
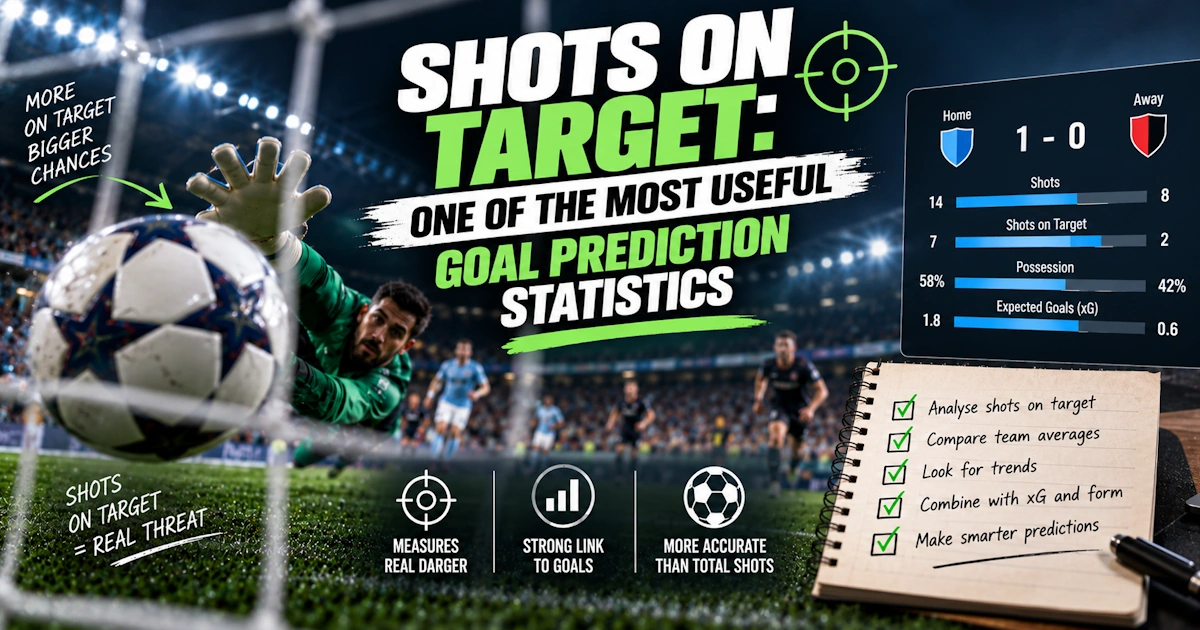
Football produces endless statistics, but not all of them are equally useful for predicting goals.
Possession can look impressive without creating danger. Total shots can be inflated by weak attempts from outside the penalty area. Corners may show attacking pressure but do not necessarily lead to clear chances.
Shots on target are different.
They tell you how often a team actually forces the goalkeeper to make a save or produces an attempt that would enter the goal without intervention. That makes them one of the simplest ways to measure genuine attacking activity.
They are not perfect, and they should never be used alone. A weak shot straight at the goalkeeper counts exactly the same as a powerful effort headed towards the top corner.
Still, when combined with expected goals, home-away form and opponent defensive numbers, shots on target can become one of the most useful statistics for analysing Over/Under, BTTS and team goal markets.
What Counts as a Shot on Target?
A shot is normally recorded as on target when it:
- Results in a goal
- Is saved by the goalkeeper
- Would have entered the goal without a defensive intervention classified as a save
Attempts that go wide, over the crossbar or hit the woodwork without entering the goal are usually not counted as shots on target.
That last point surprises some bettors.
A powerful effort that hits the post can be far more dangerous than a weak shot straight at the goalkeeper, yet the weak attempt may count as on target while the shot off the post does not.
This is one reason the statistic needs context.
Why Shots on Target Matter More Than Total Shots
Suppose Team A has 18 shots.
Team B has only 11.
At first glance, Team A appears much more dangerous.
Now look deeper:
Team A
- 18 total shots
- 3 on target
Team B
- 11 total shots
- 6 on target
The picture changes quickly.
Team A may be shooting repeatedly from poor positions. Team B is testing the goalkeeper much more often.
For goal predictions, six accurate attempts can be more meaningful than a large number of speculative shots.
This is why total shots should usually be paired with accuracy.
A team that regularly converts 15 attempts into five or six shots on target has a very different attacking profile from one that needs 20 shots to produce two accurate efforts.
What Is a Good Shots-on-Target Average?
There is no universal number that works across every league or team.
However, some practical benchmarks can help.
A team averaging:
- 2 or fewer shots on target may have limited attacking threat
- 3–4 shots on target has a reasonable scoring base
- 5 or more shots on target usually indicates a stronger attacking profile
- 6+ regularly suggests sustained pressure or high-quality attacking play
These should not be treated as rigid rules.
A team averaging four shots on target against elite defences may be performing better than one averaging six against weak opposition.
Opponent quality always matters.
Shots on Target and Over 2.5 Goals
Over 2.5 requires at least three total goals.
A match where both teams regularly test the goalkeeper has a more natural route to that total.
Imagine:
Home team
- 5.4 shots on target per home match
- 1.8 home goals
- 1.7 home xG
Away team
- 4.6 shots on target away
- 1.5 away goals
- 1.4 away xG
Combined, the teams average around 10 shots on target.
That does not guarantee three goals, but it creates a much stronger attacking profile than a match where both average only two accurate attempts.
The most attractive Over 2.5 situations often involve:
- High shots-on-target numbers
- High xG
- Weak clean-sheet records
- Both teams scoring regularly
- Defences allowing several accurate shots
When all those indicators point in the same direction, the goal case becomes much stronger.
Shots on Target and BTTS
Shots on target are especially useful for Both Teams to Score analysis.
BTTS requires two separate attacking events: one from each team.
That means you need evidence that both sides can threaten the goalkeeper.
Suppose the home side scores regularly but the visitors average only:
- 1.9 shots on target away
- 0.7 away xG
- Several matches without scoring
The match may still produce Over 2.5 if the favourite scores three.
BTTS, however, becomes less attractive.
Now imagine the visitors average 4.5 shots on target and have scored in eight of ten away matches.
That gives them a far more credible scoring route.
For BTTS, balance matters more than the combined total.
Our BTTS vs Over 2.5 comparison explains how to choose between the markets when both teams regularly threaten the goalkeeper or one side may produce most of the total alone.
Allowed Shots on Target Can Be Even More Useful
Do not analyse only attacking numbers.
Check how many shots on target the opponent allows.
A strong setup might look like this:
Home attack
- 5.2 shots on target per home match
Away defence
- Allows 5.0 shots on target per away match
This is an encouraging overlap.
Now compare:
Home attack
- 5.2 shots on target
Away defence
- Allows only 2.4
The upcoming opponent is much better at preventing accurate efforts.
The same attack should not be expected to perform identically.
One of the best ways to use this statistic is to combine shots on target created with shots on target conceded.
Expected Goals Add the Missing Quality
Shots on target tell you how often the goalkeeper is tested.
Expected goals help tell you how good those chances are.
Consider two teams.
Team A
- 6 shots on target
- 0.9 xG
Team B
- 4 shots on target
- 2.1 xG
Team A produced more accurate attempts, but they were probably lower quality.
Team B created fewer shots but from much better positions.
For goal predictions, Team B may have been more dangerous.
This is why the strongest analysis combines: shots on target + xG + shot location rather than treating any one statistic as sufficient.
Our expected goals guide explains how xG and xGA add chance quality to shot data and help distinguish repeated dangerous opportunities from accurate but relatively harmless attempts.
Not Every Shot on Target Is Equally Dangerous
A slow 25-metre attempt directly at the goalkeeper counts as one shot on target.
So does a close-range header that forces an exceptional save.
That means raw totals can sometimes exaggerate attacking quality.
If possible, check:
- Big chances
- Shots inside the box
- Average shot distance
- xG per shot
- Goalkeeper saves
- One-on-one opportunities
A team averaging five accurate shots from poor positions may be less dangerous than the total suggests.
The more context you add, the more useful the statistic becomes.
Recent Trend vs Season Average
Season averages are useful, but recent changes matter.
Suppose a team averages 3.5 shots on target for the season.
In its last five matches, however, it has produced:
- 5
- 6
- 7
- 5
- 6
That may indicate a tactical improvement, easier fixtures or a new attacking player.
Another team may have a season average of five but produced only:
- 2
- 3
- 2
- 3
- 1
Its attack may be declining.
Recent form should not completely replace the season sample, but it can identify direction.
Always ask why the numbers changed.
Home and Away Splits Matter
As with most football statistics, venue is important.
A team may average:
- 5.5 shots on target at home
- 2.8 away
The overall average of 4.2 hides a major difference.
If that team is playing away, using the overall number may overstate its attacking threat.
For home predictions, compare home attacking data with the visitor’s away defensive numbers.
For away predictions, do the opposite.
This makes the statistic much more specific to the actual fixture.
Our guide to home and away form for goal bets explains why venue-specific attacking and defensive records should normally carry more weight than broad season averages.
Practical Example: Strong Over 2.5 Candidate
Imagine a match with the following data.
Home side
- 5.8 shots on target at home
- 1.9 goals per home match
- 1.8 xG
- Over 2.5 in 7 of 10
Away side
- 4.7 shots on target away
- 1.5 away goals
- 1.4 xG
- Concedes 5.1 shots on target away
The home team also allows around four accurate attempts per match.
Both sides have credible scoring routes, and both goalkeepers are likely to be tested repeatedly.
Possible scores include 2-1, 2-2 and 3-1.
Here, Over 2.5 has statistical support from several angles.
Practical Example: Misleading High Shot Count
Now imagine a team has averaged 16 total shots in its last five matches.
That looks excellent.
But the deeper numbers show:
- Only 2.6 shots on target
- 0.9 xG
- Few big chances
- Most attempts from outside the box
The attack is active but not particularly dangerous.
Backing Team Over 1.5 based on total shots alone would be risky.
Our team total goals guide explains how scoring frequency, xG, accurate attempts and opponent defensive numbers should support the specific 0.5, 1.5 or 2.5 team line.
This is exactly where shots on target improve the analysis.
Practical Example: Low Volume, High Quality
Another team averages only nine shots.
However:
- 4.5 are on target
- xG is 1.7
- Most attempts are inside the box
- It creates several counterattacking chances
The raw shot count looks modest, but the team uses its attacks efficiently.
This may be a stronger scoring profile than the side taking 16 low-quality attempts.
Live Betting and Shots on Target
Shots on target can be especially valuable during live matches.
Suppose it is 0-0 after 65 minutes.
The match has already produced:
- 9 combined shots on target
- 2.3 xG
- Several big chances
- Attacking substitutions
The absence of a goal does not mean the match is poor.
The underlying pressure may support a late-goal market.
Now consider another 0-0:
- 2 combined shots on target
- 0.6 xG
- Few penalty-area entries
The same scoreline tells a very different story.
Live bettors should focus on the quality and frequency of chances, not simply how long the match has remained goalless.
Be Careful With Goalkeepers
Sometimes high shots-on-target numbers do not immediately produce goals because the goalkeeper is performing exceptionally well.
This can happen over one match or a short run.
Suppose a defence regularly allows six shots on target, but the goalkeeper has made several outstanding saves.
The clean-sheet statistics may look strong while the underlying defensive numbers are weak.
That can be important for future goal predictions.
A defence continuously allowing accurate shots is usually more vulnerable than one preventing them in the first place.
Shots on Target After the 75th Minute
For late-goal analysis, recent shots on target can be more useful than the full-match total.
Imagine a match has produced only five accurate efforts overall.
Three of them came in the previous seven minutes.
That suggests pressure is increasing.
Compare that with a match containing eight total shots on target but none since the 50th minute.
The headline total is higher, but the momentum is weaker.
For live betting, timing matters.
Look at what has happened in the last 10–15 minutes rather than only the accumulated number.
Our guide to predicting late goals after the 75th minute explains how recent shots on target should be combined with live xG, urgency, substitutions, fatigue and counterattacking space during the closing stages.
Common Mistakes
One common mistake is treating every shot on target as equal.
Another is ignoring xG.
A third is using season averages without adjusting for home and away performance.
Bettors also sometimes focus only on attacking numbers and forget to check what the opponent usually allows.
Finally, do not assume more shots on target automatically means more goals. Strong goalkeeping, poor shot quality and game state can still produce a low-scoring match.
The statistic works best as evidence, not as a prediction by itself.
Shots-on-Target Checklist
Before using the number in a goal prediction, check:
- Shots on target created
- Shots on target conceded
- Home and away splits
- xG
- Big chances
- Shots inside the box
- Recent trend
- Opponent quality
- Goalkeeper performance
- Tactical matchup
- Team news
- Whether both teams contribute to the shot volume
Several supporting indicators are stronger than one high total.
Frequently Asked Questions
Are shots on target better than total shots?
Usually for goal analysis, because they show how often the goalkeeper is actually tested. Total shots remain useful when combined with shot quality.
How many shots on target are good for Over 2.5?
There is no fixed threshold, but matches involving teams that consistently produce four to six accurate attempts each generally have a stronger attacking profile.
Are shots on target useful for BTTS?
Yes. BTTS becomes more convincing when both teams regularly create several accurate attempts.
Is xG more important than shots on target?
Neither should completely replace the other. Shots on target measure frequency of accurate attempts, while xG gives more information about chance quality.
Can a team score with very few shots on target?
Absolutely. Football has high variance, and one excellent chance can be enough. The statistic is more useful for estimating probability over many matches.
Final Thoughts
Shots on target are one of the most useful football statistics because they sit between simple shot volume and actual goals.
They tell you whether an attack is regularly forcing the goalkeeper into action.
For goal predictions, their value increases when they are combined with xG, home-away form, defensive numbers and chance quality.
A team consistently producing five or six shots on target deserves more attention than one accumulating harmless attempts. A defence regularly allowing accurate shots may also be more vulnerable than its recent clean-sheet record suggests.
Still, the number should never be used blindly.
Ask where the shots came from, how dangerous they were and whether the opponent’s defensive profile supports the same conclusion.
Used that way, shots on target can help turn a vague feeling that a match “looks like goals” into a much more structured prediction.
Responsible betting: Shots on target improve analysis but cannot guarantee goals. Use several statistics together, keep stakes within a fixed budget and never bet money you cannot afford to lose.