
Football results do not always tell the full story.
A team can win 3–0 despite creating only a handful of chances. Another can dominate possession, produce several clear opportunities and still lose 1–0. Looking only at the scoreline may suggest that the first team played brilliantly and the second performed poorly, even when the opposite is closer to the truth.
Expected goals, usually shortened to xG, help provide that missing context.
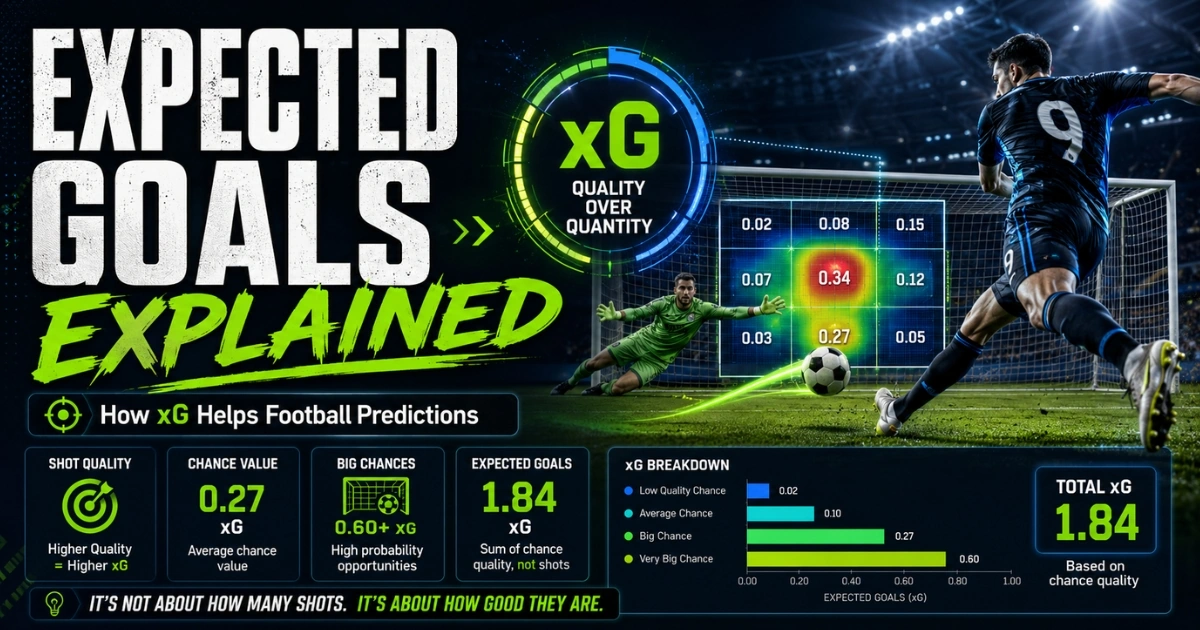
xG estimates the quality of scoring chances rather than simply counting goals or shots. It cannot predict exactly what will happen next, but it can show whether a team is consistently creating dangerous opportunities, surviving through good fortune or performing better or worse than its underlying numbers suggest.
Used properly, xG can improve analysis for match-result, Over/Under and Both Teams to Score predictions. Used badly, it becomes just another statistic followed without context.
For the broader framework, read our complete guide to football goal predictions, including Over/Under, BTTS, team form and match context.
What Is Expected Goals?
Expected goals assign a probability to each scoring chance.
A shot with an xG value of 0.10 is estimated to have roughly a 10% chance of becoming a goal. A chance worth 0.50 xG would be expected to result in a goal about half the time across a large number of similar situations.
The xG values of all shots are then added together.
For example, a team creates:
One chance worth 0.40 xG
Two chances worth 0.20 xG each
Four attempts worth 0.05 xG each
Its total would be: 0.40 + 0.20 + 0.20 + 0.05 + 0.05 + 0.05 + 0.05 = 1.00 xG
That does not mean the team should have scored exactly one goal. It means the quality of its chances added up to approximately one expected goal.
The match could still end with zero, one, two or more actual goals.
How Is xG Calculated?
Different football-data providers use slightly different models, but most consider similar factors.
These can include:
Distance from goal
Shooting angle
Whether the attempt was a header or shot
Type of assist
Position of defenders
Whether the chance came from open play or a set piece
Whether the player faced an open goal
Whether the shot followed a counterattack
Pressure on the shooter
A penalty is usually assigned a much higher xG value than a speculative shot from 30 metres because penalties are converted far more frequently.
A close-range shot in the centre of the penalty area may also carry a high value. A difficult attempt from a narrow angle will normally receive a lower value.
This is what makes xG more useful than total shots alone. Twenty poor shots do not necessarily represent better attacking football than five excellent chances.
What Do xG Numbers Mean?
There is no universal rule for interpreting every xG figure, but the numbers can provide a practical guide.
A team producing around:
Below 0.7 xG: limited attacking threat
Around 1.0 xG: moderate chance creation
Around 1.5 xG: a reasonably strong attacking performance
Above 2.0 xG: several good opportunities
Above 3.0 xG: an exceptionally productive attacking display
These are broad guidelines rather than fixed categories.
A team may produce 1.8 xG through one penalty and several weak attempts, while another reaches the same total through three clear open-play chances. The final figure is useful, but the way it was created matters too.
xG Versus Actual Goals
The difference between expected and actual goals can reveal possible overperformance or underperformance.
Suppose a team has scored 15 goals from chances worth only 9.5 xG. It has outperformed its expected total by 5.5 goals.
Possible explanations include:
Excellent finishing
Several goals from difficult chances
Goalkeeping errors by opponents
A small sample affected by unusual results
A genuinely high-quality striker
Now suppose another team has scored only seven goals from 12 xG. It may be creating enough chances but finishing poorly.
That could suggest future improvement, but it is not guaranteed. Poor finishing can continue, particularly when the team lacks reliable goalscorers.
The mistake is assuming that actual goals must immediately return to the xG number. xG highlights a possible imbalance; it does not provide a timetable for when that imbalance will disappear.
This difference is also valuable after a selection loses. Our guide on how to review a losing football prediction properly explains how to compare the original reasoning with the chances actually created and decide whether the analysis was weak or the match simply produced a different result.
Expected Goals Against
Expected goals against, usually written as xGA, measures the quality of chances a team allows its opponents to create.
This can be more revealing than goals conceded.
A team may keep three consecutive clean sheets, but if it allowed 1.8, 2.0 and 1.6 xG, the defence may have benefited from poor finishing or excellent goalkeeping.
Our guide to clean-sheet statistics and goal markets explains how to distinguish sustainable defending from results supported by goalkeeping, missed chances or short-term variance.
Another team may concede twice despite allowing only 0.7 xG. Those goals may have come from difficult shots that are unlikely to be repeated regularly.
For football predictions, compare both sides of the picture:
xG created
xGA allowed
Actual goals scored
Actual goals conceded
A strong attacking xG record combined with a low xGA figure usually suggests a well-balanced team.
Using xG for Over 2.5 Predictions
Over 2.5 goals requires at least three goals in the match. xG can help assess whether the teams regularly create and concede enough chance quality to support that total.
Imagine the home team averages:
1.9 xG created at home
1.3 xGA at home
The visitors average:
1.4 xG created away
1.7 xGA away
Those figures suggest potential chances at both ends. They do not guarantee three goals, but they support the possibility of an open match.
The strongest Over candidates may involve:
High combined xG
High xGA from one or both teams
Frequent shots from dangerous positions
Low clean-sheet percentages
Strong recent chance creation
However, do not simply add the two teams’ averages and treat the result as a prediction. The quality of opposition, game state and tactical matchup can change the expected pattern.
Our guide on how to predict Over 2.5 goals shows how xG should be combined with scoring averages, defensive records, venue splits and shots on target.
Using xG for Under 2.5 Predictions
Under 2.5 predictions can also benefit from expected-goals data.
Look for teams that:
Create low xG totals
Allow few high-quality chances
Depend on long-range shooting
Play at a slow tempo
Have strong defensive structures
For example, one team averages 0.9 xG created and 0.8 xGA, while the opponent averages 1.0 xG and 0.9 xGA.
That provides a reasonable foundation for a low-scoring prediction, especially when supported by strong Under percentages and few shots on target.
Be careful when recent low scores do not match the chance quality. Three consecutive 1–0 results may look ideal for Under, but if the matches produced combined xG totals above 3.0, the results may have depended on poor finishing.
For a complete low-scoring analysis, read our guide on how to predict Under 2.5 goals without relying only on recent results.
Using xG for BTTS Predictions
Both Teams to Score requires each side to find the net at least once.
For BTTS – Yes, ask whether both teams consistently create enough chances to score.
Useful signs include:
Both average above 1.0 xG
Neither has a strong defensive xGA record
Both generate good chances at the relevant venue
Failure-to-score percentages are low
Both allow regular shots inside the penalty area
Suppose the home team averages 1.7 xG at home and the visitors average 1.3 xG away. If both also concede more than 1.2 xGA, BTTS may have a credible statistical foundation.
BTTS becomes weaker when one side creates very little, even if the opponent regularly takes part in high-scoring matches.
A strong favourite with high xG does not automatically make BTTS attractive if the underdog averages only 0.6 xG away.
Our BTTS vs Over 2.5 comparison explains why strong xG from one dominant team may support the total-goals market without supporting Both Teams to Score.
Why Recent xG Trends Matter
Season-long averages provide stability, but recent xG trends can show whether a team is improving or declining.
A club may average 1.4 xG across the season but produce:
2.1 xG
1.9 xG
2.3 xG
1.8 xG
2.0 xG
in its last five matches. That suggests its attack may currently be stronger than the full-season average indicates.
The opposite can happen after injuries, a managerial change or a difficult run of opponents.
Defensive absences can also change the meaning of recent xGA figures. Our guide to how missing defenders affect football goal predictions explains how goalkeeper changes, unfamiliar centre-back partnerships and tactical adjustments can alter the quality of chances allowed.
Compare:
Last five matches
Last ten matches
Full-season average
Home and away xG
Strength of opposition
Venue splits deserve separate attention because overall xG can hide very different home and away performances. See our guide to home and away form for goal bets.
Do not judge a trend from one exceptional performance.
Practical Example
Imagine a home team has won its previous three matches:
2–0
3–1
2–1
Its results look excellent. However, its xG totals were:
0.9
1.1
0.8
The team scored seven goals from only 2.8 xG. That level of finishing may be difficult to maintain.
The visitors have lost twice and drawn once:
0–1
1–2
1–1
Yet their xG totals were:
1.7
1.5
1.8
The scorelines suggest poor form, but the underlying performances show consistent chance creation.
This does not mean the visitors will definitely win. It does suggest that the gap between the teams may be smaller than the recent results imply.
For a goal-market prediction, the visitors may also have a stronger scoring chance than their recent record suggests.
Limitations of Expected Goals
xG is useful, but it is not perfect.
Different providers can assign different values to the same chance. Models may also struggle to capture every detail, such as the exact positioning of defenders or the quality of the player taking the shot.
Other limitations include:
Small samples
Penalties inflating totals
Game-state effects
Red cards
Team quality
Individual finishing ability
Goalkeeper performance
Tactical changes
Dismissals can distort both the final score and the xG pattern because the two teams may completely change their tactical approach. Our guide explains how red cards affect Over/Under goal bets.
A team leading 2–0 may stop attacking and allow the opponent to create chances. Those late chances increase the opponent’s xG but may not reflect how the match would have developed from 0–0.
Context remains essential.
A Simple xG Checklist
Before using xG in a prediction, check:
xG created and xGA conceded
Home and away figures
Recent and season-long trends
Actual goals compared with xG
Number and quality of chances
Penalties and red cards
Strength of opposition
Injuries and tactical changes
Whether the xG supports other statistics
Whether the available odds offer value
xG works best when it confirms a broader match analysis.
Frequently Asked Questions
Does 2.0 xG mean a team should score two goals?
No. It means the combined quality of the chances was worth roughly two expected goals across a large sample. In one match, the team could score none or several.
Is xG better than goals scored?
It answers a different question. Goals show what happened, while xG estimates the quality of the chances that produced the result.
Can xG predict the exact score?
No. It can help estimate attacking and defensive strength, but exact scores remain highly uncertain.
Which is more important, xG or shots on target?
Both are useful. Shots on target show how often the goalkeeper was tested, while xG considers how likely each chance was to become a goal.
Our guide to shots on target for goal predictions explains how accurate attempts should be interpreted alongside xG, shot quality and opponent defensive numbers rather than used as a standalone statistic.
Should penalties be included?
Most xG data includes penalties. When analysing open-play performance, it can be useful to check non-penalty xG separately.
Final Thoughts
Expected goals provide a deeper view of football performance than scorelines alone.
They can reveal whether a team is creating sustainable chances, relying on exceptional finishing or conceding fewer goals than its defensive performances suggest. This makes xG useful for Over/Under, BTTS and match-result predictions.
The key is not to treat the number as a guaranteed forecast.
Combine xG with home and away form, shots on target, team news, tactics and match context. When several indicators support the same scenario, the prediction has a stronger foundation than one based only on recent results.
Explore our football betting resources for more guides covering goal markets, match statistics and prediction strategies.
Responsible betting: Statistics can improve analysis, but they cannot remove uncertainty. Use a fixed budget and never stake money you cannot afford to lose.