
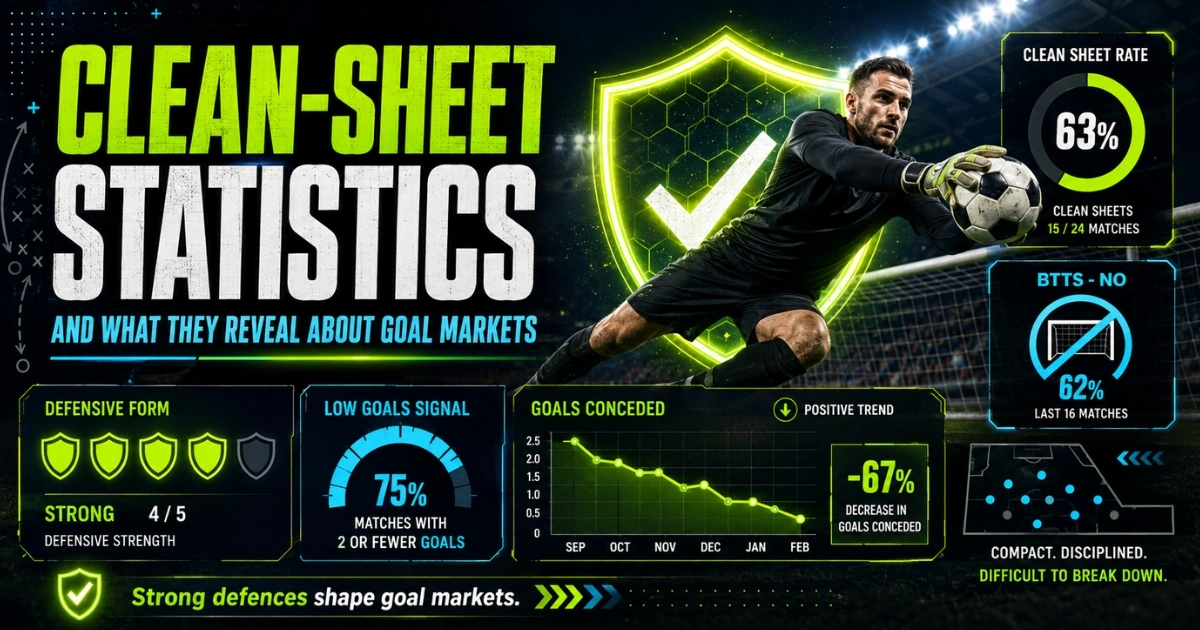
Clean-sheet statistics are often treated as a simple measure of defensive strength. A team either conceded or it did not.
For goal-market predictions, however, clean sheets can reveal much more.
They can help assess whether Both Teams to Score is realistic, whether an Under 2.5 selection has a strong foundation and whether a favourite is likely to win without conceding. They can also expose misleading defensive records when a team keeps clean sheets despite allowing several high-quality chances.
The key is to understand how those clean sheets were achieved.
A team that regularly limits opponents to one or two weak shots is different from one relying on excellent goalkeeping, missed penalties and poor finishing. Both may have the same clean-sheet percentage, but the first record is usually more sustainable.
Clean-sheet data should therefore be used as part of a broader football goal prediction analysis that also considers attacking output, venue form, chance quality and match context.
What Is a Clean Sheet?
A clean sheet means a team completes the match without conceding a goal.
Results such as these count as clean sheets:
0–0
1–0
2–0
3–0
The number of goals scored by the team does not matter. The only requirement is that the opponent finishes with zero.
A clean-sheet percentage is calculated by dividing the number of clean sheets by the number of matches played.
For example, if a team keeps six clean sheets in ten matches, its clean-sheet rate is 60%.
That percentage can be useful, but it should always be analysed alongside the team’s scoring record, home and away form, expected goals against and the quality of its opponents.
Why Clean Sheets Matter for Goal Betting
Clean sheets directly affect several popular markets.
For BTTS – Yes, both teams must score. One clean sheet is enough to make the selection lose.
For BTTS – No, at least one side must fail to score. A team with a strong clean-sheet record may therefore provide a solid starting point.
For Under 2.5 goals, clean sheets often support lower totals, especially when combined with limited attacking output.
A match can still finish Over 2.5 with a clean sheet, such as 3–0 or 4–0. This means defensive statistics should never be interpreted in isolation.
The important question is whether the clean-sheet team is also capable of scoring heavily.
Our BTTS vs Over 2.5 comparison explains why a likely clean sheet may weaken Both Teams to Score while still allowing the favourite to take the match Over by winning 3–0 or 4–0.
Clean-Sheet Percentage
The basic clean-sheet percentage shows how often a team prevents its opponent from scoring.
As a practical example:
Two clean sheets in ten matches suggest defensive vulnerability.
Five in ten indicate a respectable record.
Seven or more may point towards a highly reliable defence.
These are only broad benchmarks. League strength, opponent quality and sample size can change their meaning.
A team dominating a weaker domestic competition may keep many clean sheets because opponents rarely reach its penalty area. The same team could struggle defensively in European competition against stronger attacks.
A clean-sheet percentage becomes more useful when it is compared with the standard of opposition faced.
Home and Away Clean Sheets
Overall defensive statistics can hide major venue differences.
Some teams defend confidently at home but become much more vulnerable away. Others sit deeper on the road and actually keep more clean sheets as visitors.
For the home team, check:
Home clean-sheet percentage
Home goals conceded
Home expected goals against
Shots on target allowed at home
For the visitors, use the equivalent away figures.
Practical example: A team may have kept clean sheets in 50% of its league matches overall, but the split shows:
Seven clean sheets in ten home matches
Three clean sheets in ten away matches
If the next fixture is at home, the 70% home figure is more relevant than the overall percentage.
Venue-specific data is especially important for BTTS and team-total markets.
Read our guide to home and away form for goal bets for a wider explanation of how venue-specific scoring, conceding and clean-sheet records should be compared.
Clean Sheets and BTTS Predictions
Clean-sheet statistics are naturally connected to Both Teams to Score.
For BTTS – Yes, you generally want:
Low clean-sheet rates from both teams
Low failure-to-score rates
Regular goals scored at the relevant venue
Defences allowing good-quality chances
For BTTS – No, you may look for:
A strong favourite with frequent clean sheets
An opponent that regularly fails to score
A large difference in attacking quality
A match expected to be tactically controlled
Imagine the home team has kept six clean sheets in ten home matches. The visitors have failed to score in five of ten away games.
Those two statistics support the same scenario: the away side may struggle to contribute.
BTTS – No may therefore be more suitable than Under 2.5, particularly if the home team is capable of winning 3–0.
When the main question is whether one side can score at all, our team-to-score betting guide explains how scoring frequency, opponent clean-sheet rates, xG, shots on target and venue form can be combined before making a selection.
Clean Sheets and Under 2.5 Goals
A high clean-sheet rate can support Under 2.5, but only when the likely scoring total remains limited.
Suppose the home team keeps many clean sheets but also averages 2.6 goals per home match. Its fixtures can still finish 3–0 or 4–0.
In that case:
BTTS – No may remain attractive.
Under 2.5 becomes riskier.
A home-team goal market may be more appropriate.
Under 2.5 becomes stronger when clean sheets are combined with:
Low goals scored
Low average total goals
High failure-to-score rates
Low xG
Few shots on target
Cautious tactics
For example, a team that keeps six clean sheets in ten matches but scores only 1.0 goal per game is naturally more supportive of Under than a dominant attacking favourite with the same defensive record.
Our guide on how to predict Under 2.5 goals explains how clean sheets should be combined with low scoring averages, limited xG, failure-to-score rates and cautious tactics.
Expected Goals Against
Expected goals against, or xGA, helps determine whether a clean-sheet record is sustainable.
A team may keep a clean sheet while allowing chances worth 2.0 xGA. The result looks defensively strong, but the underlying performance suggests the opponent had several good opportunities.
Another team may keep a clean sheet while allowing only 0.4 xGA. That indicates the defence genuinely limited chance quality.
When studying clean sheets, compare:
Actual goals conceded
Expected goals against
Shots on target allowed
Big chances conceded
A team repeatedly conceding fewer goals than its xGA may be benefiting from:
Excellent goalkeeping
Poor opposition finishing
Last-ditch blocks
Short-term luck
That does not mean the clean-sheet trend will immediately end, but it deserves caution.
For a deeper explanation of xG and xGA, read our guide to expected goals and how chance quality can reveal defensive weakness hidden by the final score.
Goalkeeper Influence
Goalkeepers can significantly affect clean-sheet statistics.
A high-quality goalkeeper may save shots that an average player would concede. Strong shot-stopping is not simply luck and may remain valuable across a long season.
However, a defence that allows constant pressure is still vulnerable.
Check whether the clean sheets were built on:
Few shots faced
Strong defensive organisation
Repeated difficult saves
Opponents missing clear opportunities
The ideal situation is a reliable goalkeeper playing behind a defence that limits both the number and quality of shots.
When the first-choice goalkeeper is unavailable, previous clean-sheet percentages may become less relevant.
The same applies when key defenders are missing. Our guide to how missing defenders affect football goal predictions explains how replacement quality, defensive partnerships and tactical changes can alter the expected pattern.
Strength of Opposition
Not all clean sheets carry equal weight.
Keeping a clean sheet against one of the strongest attacks in the league is more impressive than doing so against a team that rarely scores.
Review who the team faced.
For example, six recent clean sheets may have come against opponents ranked near the bottom for goals scored. The next match could be against the league’s most productive attack.
The headline percentage remains the same, but the context has changed completely.
Compare defensive performances against teams with similar attacking quality to the upcoming opponent.
Tactical Style
Clean sheets are often the result of a broader tactical approach.
Some teams defend with a low block, reduce space near their penalty area and accept limited possession. Others press high and prevent opponents from building attacks.
Both approaches can produce clean sheets, but they carry different risks.
A deep defence may be difficult to break down but vulnerable to:
Set pieces
Long-range shots
Deflections
Late pressure
A high defensive line may control weaker opponents but become exposed against fast forwards.
Understanding the tactical reason for the clean-sheet record helps predict whether it can continue in the next matchup.
Set Pieces and Penalties
A team may defend well in open play and still concede from dead-ball situations.
Before relying heavily on clean-sheet statistics, check:
Goals conceded from corners
Free-kick defending
Penalty frequency
Aerial weaknesses
Fouls around the penalty area
This is particularly important in matches expected to contain few open-play chances. One corner or penalty can destroy a clean sheet and change the entire goal-market result.
A strong open-play defence is encouraging, but set-piece vulnerability should still be included in the risk assessment.
Practical Example: BTTS – No
Consider a match with these statistics:
Home team
Clean sheets in 7 of 10 home matches
Only 0.6 goals conceded per home game
Average home xGA of 0.7
Allows fewer than three shots on target
Away team
Failed to score in 5 of 10 away matches
Averages 0.8 goals away
Creates only 0.9 away xG
Main striker unavailable
The evidence strongly suggests that the visitors may struggle to score. BTTS – No has a clear statistical foundation.
Under 2.5 may also be considered, but it depends on the home team’s attacking output. If the hosts average 2.5 goals, a 3–0 result remains possible.
When both teams combine strong clean-sheet records with limited attacking output, our guide to identifying matches that could finish 0-0 provides a more specific framework for assessing the goalless-draw scenario.
Practical Example: Misleading Clean Sheets
Now imagine a team has kept four consecutive clean sheets.
At first glance, that looks excellent. The deeper numbers show:
Average xGA of 1.7
Six shots on target allowed per match
Two missed penalties
Several major goalkeeper saves
The clean-sheet sequence may not reflect genuine defensive control.
If the next opponent has a strong attack and reliable finishing, BTTS – Yes or an opponent goal market could still be reasonable despite the recent results.
This is why the performance behind the clean sheet matters more than the zero alone.
Common Mistakes
One mistake is assuming that frequent clean sheets automatically support Under 2.5. A dominant team can keep a clean sheet and score three or four goals itself.
Another is ignoring the venue. Strong home defending may disappear in away fixtures.
It is also risky to follow a short clean-sheet streak without checking xGA and shot quality.
Finally, do not treat all opponents equally. Defensive success against weak attacks may not transfer to a much tougher fixture.
Clean-Sheet Analysis Checklist
Before using clean-sheet data, check:
Overall clean-sheet percentage
Relevant home or away record
Goals conceded per match
Expected goals against
Shots on target allowed
Strength of previous opponents
Goalkeeper availability
Defensive injuries
Set-piece performance
Opponent failure-to-score rate
The favourite’s own scoring potential
The strongest goal predictions appear when several of these indicators support the same scenario.
Frequently Asked Questions
Does a clean sheet automatically mean Under 2.5?
No. A match can finish 3–0, 4–0 or 5–0. The scoring strength of the clean-sheet team must also be considered.
Are clean sheets useful for BTTS predictions?
Yes. High clean-sheet rates can support BTTS – No, especially when the opponent also has a high failure-to-score percentage.
How many matches should I analyse?
Use at least five to ten relevant matches where possible, while comparing recent form with the wider season record.
Is xGA more important than clean sheets?
They measure different things. Clean sheets show the actual outcome, while xGA helps assess whether the defensive performance was sustainable.
Should home and away clean sheets be separated?
Yes. Many teams have significantly different defensive records depending on the venue.
Final Thoughts
Clean-sheet statistics can provide valuable clues about goal markets, but the raw percentage is only the beginning.
A reliable defensive record should ideally be supported by low xGA, few shots on target, strong goalkeeping and consistent performances against good opponents. Home and away splits then show whether that strength is relevant to the upcoming fixture.
For BTTS, clean sheets help identify whether one side may fail to score. For Under 2.5, they must be combined with attacking output because a strong favourite can keep a clean sheet and still take the match Over alone.
The most useful question is not simply whether a team has kept clean sheets. It is whether the way those clean sheets were achieved can realistically be repeated.
Explore our football betting resources for more guides covering goal markets, football statistics and match analysis.
Responsible betting: Use statistics as analytical tools rather than guarantees, set a fixed budget and never stake money you cannot afford to lose.