
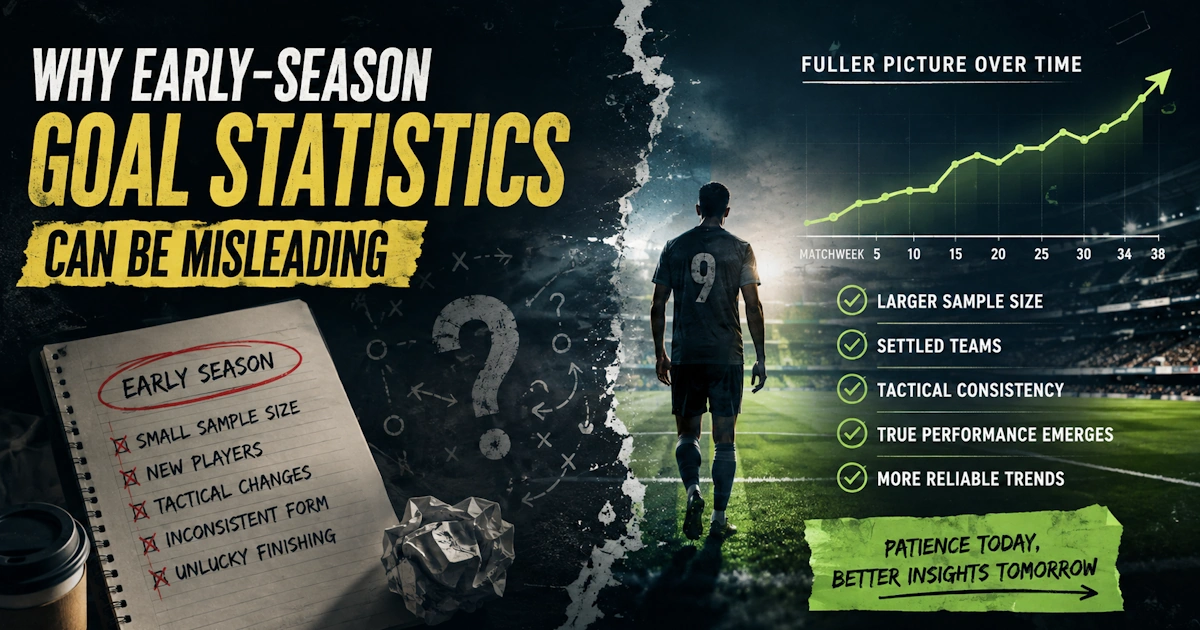
The first few weeks of a football season can produce some very convincing statistics.
A team may have gone Over 2.5 goals in four of its first five matches. Another might have kept three clean sheets in a row. A newly signed striker could already have five goals, while a club that was highly attacking last season suddenly appears unable to score.
The temptation is obvious: assume that these numbers reveal what the team will be like for the rest of the season.
Sometimes they do. Often they do not.
Early-season statistics are built from small samples, uneven fixture lists and teams that are still adjusting to transfers, new managers and different tactical systems. One unusual 5-2 result can completely distort a goal average when only four matches have been played.
For goal predictions, early-season data is still useful. It simply needs much more context than statistics collected over 20 or 30 matches.
For the broader analytical framework, read our guide to football goal predictions, including form, venue data, expected goals, team news and tactical context.
Small Samples Can Create Extreme Percentages
The biggest problem is sample size.
Suppose a team has played five matches and four have finished Over 2.5 goals.
Its Over 2.5 rate is 80%.
That sounds extremely strong.
But one additional 1-0 result would immediately reduce the rate to 67%. Two more low-scoring matches would bring it down to 57%.
The percentage moves quickly because there are so few matches behind it.
Compare that with a team that has played 30 fixtures. If 24 finished Over 2.5, one additional Under result barely changes the overall rate.
That is why early percentages should be treated as provisional.
Our guide on how to predict Over 2.5 goals explains which team-level statistics should support an Over trend before a percentage is treated as meaningful.
A useful approach is to ask whether the statistic is supported by the way the team is actually playing.
If four of five matches went Over because the team is creating high xG, allowing many shots and playing an aggressive style, the trend has some substance.
If one 6-1 result is doing most of the work, the percentage may be misleading.
One Big Scoreline Can Distort Goal Averages
Average goals per match can be particularly deceptive early in the season.
Imagine a team begins with these scores:
1-0
0-0
1-1
5-2
Across four matches, that gives 10 total goals, or an average of 2.5 per match.
At first glance, the team looks relatively high-scoring.
But seven of those ten goals came from one unusually open game.
The other three fixtures averaged just one goal each.
This is why median scores, individual match patterns and Over/Under percentages can sometimes be more useful than the simple average.
Always check how the goals were distributed.
A team consistently producing 2-1 and 2-2 results is very different from one producing three low-scoring games followed by one freak result.
Fixture Difficulty Can Completely Change the Picture
Early schedules are rarely balanced.
One team may start against:
Two promoted clubs
A struggling defence
Three home fixtures
Another may begin against:
The defending champions
Two top-six teams
Several difficult away trips
Comparing their first five scoring averages directly would make little sense.
Suppose Team A scores 12 goals in five matches, but four opponents are among the weakest defences in the league.
Team B scores six during the same period but has faced three elite defensive teams.
Team A’s raw numbers look much stronger, yet Team B may actually have produced the more impressive attacking performances.
When analysing early goal statistics, check opponent strength before treating a trend as reliable.
The same fixture imbalance can distort the standings themselves. Our guide to why the league table can be misleading early in the season explains how schedule strength, home-away balance and small samples can temporarily make teams appear stronger or weaker than their performances suggest.
For a league-specific example of analysing matches before reliable current-season data exists, read our Premier League opening weekend goal predictions guide.
The same caution applies to European competition. Our Champions League Matchday 1 goal-markets guide explains how early-season domestic data, league strength, new signings and limited current-season samples should be adjusted before choosing Over/Under or BTTS markets.
Home and Away Balance Matters
The early fixture list can also distort venue-specific numbers.
A team may have played four home matches and only one away game.
Its overall scoring rate will therefore be heavily influenced by home performance.
If that team is now travelling to a difficult opponent, the five-match average may have limited relevance.
Always separate:
Home goals scored
Away goals scored
Home goals conceded
Away goals conceded
Home Over 2.5 percentage
Away Over 2.5 percentage
Even with small samples, the correct venue is usually more informative than the overall number.
If there are only two away matches available, last season’s away statistics may still deserve some weight.
Our guide to home and away form for goal bets explains why the relevant home or away profile should usually carry more weight than a combined season average.
Expected Goals Can Reveal Unsustainable Finishing
Early-season finishing can run hot or cold.
A striker may score five times from relatively few chances. Another team may create excellent opportunities without converting them.
Expected goals can help distinguish the two.
Consider two teams after five matches.
Team A
11 goals scored
6.0 xG
Team B
6 goals scored
9.5 xG
Team A has been extremely efficient. It may have scored several difficult shots or benefited from goalkeeper mistakes.
Team B’s actual total looks weaker, but the underlying chance creation is stronger.
If you simply compare goals scored, Team A appears much more suitable for Over markets.
If you add xG, the picture becomes less obvious.
For a deeper explanation, our expected goals guide shows how goals versus xG and goals conceded versus xGA can reveal whether early finishing levels are likely to be sustainable.
Early in the season, it can be useful to compare:
Goals vs xG
Goals conceded vs xGA
Shots on target
Big chances
Penalty-area touches
These indicators help show whether the headline scorelines reflect repeatable performance.
Penalties and Red Cards Can Skew the Numbers
Small samples are particularly vulnerable to unusual match events.
Suppose a team has conceded nine goals in five matches.
That looks poor.
But imagine four were conceded while playing with ten men after an early red card.
The defensive average still counts those goals, yet it may exaggerate the team’s normal vulnerability.
Penalties can do the same thing.
A team that has received three penalties in five matches may have an inflated scoring average that is unlikely to continue.
Before trusting early totals, check whether they were influenced by:
Red cards
Penalties
Own goals
Goalkeeper errors
Long periods against ten men
Very late goals when a match was already decided
Context becomes even more important when the sample is small.
Our guide to how red cards affect Over/Under goal bets explains why goals scored or conceded while one team has ten players should not always be treated like a normal match pattern.
New Managers Need Time
Managerial changes are another reason early numbers can be deceptive.
A team may be learning:
A higher defensive line
Different pressing triggers
A new formation
Build-up from the back
More aggressive full-back positioning
The first few matches can produce defensive mistakes that disappear once players become familiar with the system.
The reverse can also happen.
A new manager may begin cautiously, prioritising defensive structure before gradually introducing more attacking freedom.
Imagine a team records three straight Under 2.5 results under a new coach. It would be dangerous to assume that the club has permanently become defensive after only 270 minutes of football.
Look for tactical intent rather than only final scores.
Transfers Can Take Time to Affect the Statistics
New players do not always settle immediately.
A striker may need time to understand where teammates deliver crosses. A new centre-back partnership may initially struggle with communication. A creative midfielder may still be building fitness.
Transfer timing matters too.
A team could play its first three matches without an important signing who then becomes a regular starter.
Those early statistics belong to a slightly different version of the team.
When reviewing early-season form, ask:
Were key signings available?
Did they start?
Has the first-choice eleven changed?
Did important players leave late in the transfer window?
Has a new goalkeeper or centre-back partnership been introduced?
Statistics become more trustworthy once the team itself becomes more stable.
For individual arrivals, our guide on how long bettors should wait before trusting a new signing explains how minutes played, tactical role, fitness and underlying performance can show whether a player’s early statistics are becoming reliable.
Around the end of the transfer window, that stability can change overnight. Our guide to how Transfer Deadline Day changes football predictions explains how arrivals, departures and expected line-ups can make recent statistics less representative.
Promoted Teams Are Especially Difficult to Judge
Promoted sides often create extreme early narratives.
One may lose its first three matches and immediately be labelled unable to compete.
Another may win twice and be described as the season’s surprise package.
Both conclusions can be premature.
Promoted teams are adjusting to stronger opposition, while opponents are also learning how to play against them.
A side that produced Over 2.5 in four of its first five matches may eventually become more defensive once the manager recognises that the previous system is too open.
Another may initially struggle to score before adapting to the faster level.
Early statistics for promoted clubs should therefore be combined with tactical observation and previous lower-division data.
For a complete framework, read our guide to analysing newly promoted teams, including lower-division form, squad changes, tactical adaptation and early top-flight performances.
Pre-Season Can Help, but Only a Little
Pre-season provides additional context when competitive data is scarce.
If a team created chances consistently throughout friendly matches and continues doing so in the league, its early attacking numbers become more believable.
However, pre-season contains its own problems:
Heavy rotation
Youth players
Different fitness levels
Weak opposition
Experimental formations
Use pre-season to identify tactical intentions, not to inflate the sample with meaningless scorelines.
A 6-0 friendly win against lower-level opposition should not be treated like a competitive league match.
Recent Form Still Matters More Than Old Data
The answer is not to ignore early-season statistics and rely completely on last season.
Football teams change.
If a club has replaced its manager, striker, goalkeeper and two defenders, last season’s numbers may describe a team that no longer exists.
A better approach is to combine the two periods.
Early in the season, you might give more attention to:
Current tactical structure
Current squad
New signings
Recent xG
Last season’s broader home and away trends
As more matches are played, current-season data can gradually take greater weight.
Think of early-season statistics as evidence that is still being collected rather than a finished conclusion.
Practical Example: Misleading Over 2.5 Trend
Imagine Team A has produced Over 2.5 in four of five matches.
The headline rate is 80%.
But closer analysis shows:
One match finished 5-3 after an early red card
Two opponents were promoted teams
Three games were at home
Actual goals: 11
xG: only 7.1
The 80% rate suddenly looks less convincing.
If Team A now travels to one of the league’s strongest defences, blindly following the early Over trend would be risky.
Practical Example: Misleading Low-Scoring Team
Team B has produced Under 2.5 in four of its first five fixtures.
However:
It has generated 1.8 xG per match
Hit the woodwork several times
Missed a penalty
Averaged five shots on target
Created 10 big chances
The attack may be functioning normally despite the lack of goals.
If the next opponent concedes plenty of chances, Over 2.5 could still be reasonable even though Team B’s early percentage says Under.
This is why underlying performance often tells you more than the result alone.
The same principle applies to individual team-goal markets. Our team-to-score betting guide explains how scoring frequency should be checked against xG, shots on target, opponent conceding rates and team news.
When Do Goal Statistics Become More Reliable?
There is no magical number.
Ten matches are clearly more informative than three, but even ten can be distorted by an unusual schedule.
By around 8–12 league games, patterns usually become easier to evaluate because:
Home and away samples are larger
Teams are more settled
New signings have adapted
Fixture difficulty begins to balance
Extreme scorelines have less influence on averages
Even then, statistics should never be used without context.
Football changes throughout the season.
Early-Season Goal Checklist
Before trusting an early trend, check:
Number of matches played
Strength of opponents
Home and away balance
Whether one extreme score distorted the average
Goals compared with xG
Shots on target
Penalties and red cards
New managers
Transfer activity
Promoted-team adjustment
Injuries
Whether recent tactical performances support the numbers
Frequently Asked Questions
How many matches are too few for reliable goal statistics?
Three to five matches are usually too small to treat percentages as stable. They can provide clues, but strong conclusions should be avoided.
Should I ignore early-season Over 2.5 percentages?
No. Use them as an early signal and then check whether xG, shots and tactical performance support the trend.
Is last season’s data more reliable?
It has a larger sample, but squad and managerial changes may reduce its relevance. Combining old and new information is usually better.
Can xG be more useful than goals early in the season?
Often, yes. It can show whether unusually high or low scoring is supported by the quality of chances being created.
When do current-season statistics become more useful?
After roughly 8–12 matches, patterns usually become more stable, although fixture difficulty and team changes should still be considered.
Final Thoughts
Early-season goal statistics are valuable, but they are easy to overinterpret.
A few unusual matches can create extreme Over percentages, inflated averages and misleading clean-sheet records. Uneven schedules, new managers, transfers and promoted teams add further uncertainty.
The solution is not to ignore the numbers.
It is to ask why those numbers exist.
Look beyond goals to expected goals, shots, opponent strength and tactical performance. Separate home and away form, identify unusual match events and consider whether the current starting eleven is even the same one that produced the early results.
As the season develops, the numbers become more stable. Until then, treat early statistics as clues rather than conclusions.
Responsible betting: Small samples can create false confidence. Use statistics as part of a wider analysis, keep stakes within a fixed budget and never bet money you cannot afford to lose.