A Champions League team averages 1.8 xG per match. That sounds useful. But when is that attacking threat actually being created?
Perhaps the team regularly produces 1.2 xG before half-time and only 0.6 after the break. Another team may reach the same 1.8 total in exactly the opposite way: 0.5 first-half xG and 1.3 second-half xG. The full-match number is identical. The likely match pattern is not.
This is why splitting expected goals into first-half and second-half xG can add another useful layer to Champions League prediction analysis. It can help identify teams that start aggressively, teams that improve after tactical adjustments, teams that become more dangerous when chasing matches, and defences that repeatedly weaken late.
But half-by-half xG also comes with a major warning: the scoreline itself can cause the split. A team producing less xG in the second half may not be physically fading. It may simply have taken a 2-0 lead and stopped taking unnecessary attacking risks.
So the objective is not to find which half has the bigger number. It is to understand why the difference exists.
What Is First-Half xG?
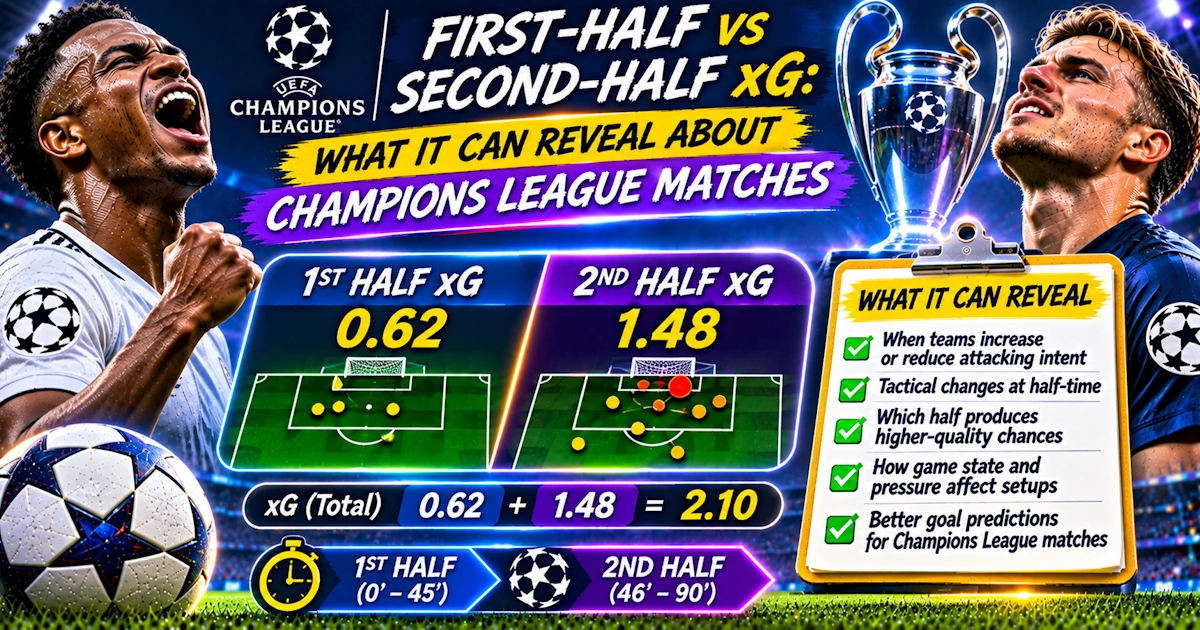
First-half xG is simply the total expected-goal value of shots created before half-time. Imagine Team A produces these chances: 0.10 xG, 0.25 xG, 0.40 xG, and 0.15 xG. Its first-half total is 0.90 xG.
If it then creates another 1.20 xG after the interval, its full-match total becomes 2.10 xG. Splitting that total tells you more about the attacking pattern than the final 2.10 alone.
Why Is the Split Useful?
Two teams can have identical full-match averages while behaving very differently:
Team A: First-half xG 1.05, Second-half xG 0.65 (Total: 1.70 xG)
Team B: First-half xG 0.55, Second-half xG 1.15 (Total: 1.70 xG)
Team A looks like a stronger candidate for Over 0.5 First-Half Goals or First-Half Team Total markets. Team B may be more interesting for second-half goals or late-goal markets. The full-match statistic cannot show that distinction.
Champions League Goals Often Increase Later
There is good reason to examine second halves separately. Official UEFA Champions League analysis of the 2023/24 group stage found that more goals were scored in the second half than the first. Almost one-fifth of all goals—19.6%—arrived between the 81st minute and full time, while 22 of the 96 matches featured a winning goal during the final 15 minutes.
The 2024/25 league phase showed a similar late-goal pattern. UEFA found that 23% of all goals were scored after the 75th minute, including added time. The 76th–90th minute period alone produced 87 goals. Those numbers do not mean second-half goals are automatically good bets, but they do show why analysing the two halves separately can be useful.
Broader Football Research Finds More Second-Half Goals Too
The pattern is not unique to the Champions League. A 2024 study covering the five major European leagues across the 2018/19, 2019/20 and 2020/21 seasons found that goals occurred significantly more often in the second half than the first. The researchers also identified a relationship between second-half substitutions and subsequent goal activity.
Possible explanations include:
Tactical changes
Fatigue
Defensive concentration declining
More aggressive substitutions
Teams taking greater risks as time disappears
But these factors interact with the scoreline. That is where xG splits become especially interesting.
First-Half xG Can Identify Fast-Starters
Suppose a team regularly produces 1.0+ first-half xG. That may indicate an aggressive opening press, strong rehearsed attacking patterns, early territorial control, and frequent chances before opponents settle.
Imagine its last five Champions League first halves produced 1.1 xG, 0.9 xG, 1.3 xG, 0.8 xG, and 1.2 xG. That is a much stronger first-half attacking signal than simply knowing the team scored in four of those matches. Goals can fluctuate; repeated chance creation is more informative.
Practical Example: Strong First-Half Profile
Home team: First-half xG average 1.05, First-half shots on target 3.1
Away team: First-half xGA 0.85, frequently concedes early territory
Now add home advantage, a strong attacking lineup, and no major defensive absences for the visitor. This can provide a reasonable statistical foundation for Over 0.5 First-Half Goals—a much stronger argument than “Their last three matches had a first-half goal.”
A First-Half Goal Record Can Be Misleading
Suppose another team has scored before half-time in 5 consecutive matches. Looks excellent. But its first-half xG totals were 0.25, 0.31, 0.42, 0.28, and 0.35. The goals have arrived, yet the chance creation is weak. This may be a finishing streak rather than a strong repeatable first-half attacking process. Always compare first-half goals with first-half xG.
Second-Half xG Can Reveal Teams That Improve After the Break
Some clubs are consistently stronger during the second half due to tactical changes at half-time, stronger substitutes, opponents tiring, higher risk as the match develops, or better physical depth.
UEFA provided a good Champions League example during the 2025/26 season. Against Benfica, Juventus generated only 0.37 xG in the first half. After Luciano Spalletti altered the attacking structure and moved Weston McKennie into a more central role, Juventus produced 1.02 xG in the second half. The full-match total tells us Juventus created 1.39 xG; the split tells us when and why their attack became more effective.
Half-Time Tactical Changes Matter
The interval gives managers time to reorganise the team properly—changing formation, pressing structure, player positioning, width, or build-up patterns. UEFA highlighted Barcelona’s 2025/26 comeback against Eintracht Frankfurt as an example. Barcelona struggled against a deep defensive structure during the first half before Hansi Flick changed the team’s shape and introduced Marcus Rashford at half-time to create greater width and space. Poor first-half attacking numbers do not always continue after the break.
Practical Example: Slow Starter With Strong Second Halves
Imagine Team A’s averages are 0.55 first-half xG and 1.20 second-half xG. A casual bettor may look at its first-half matches and conclude “This attack is struggling.” But perhaps Team A starts patiently, studies the opponent, has an excellent bench, and increases pressing after half-time. Now a 0-0 half-time score may not automatically support a full-match Under—it might actually create an attractive second-half setup.
Game State Is the Biggest Complication
Suppose Team A has 1.20 first-half xG and 0.60 second-half xG. Does that mean the team physically fades? Maybe not. What if it frequently leads at half-time?
Once ahead, it may deliberately reduce pressing, keep more players behind the ball, attack through counters, and protect the result. Its lower second-half xG is then partly a consequence of success. This is why half splits should never be analysed without understanding how game state changes the way teams play.
A Winning Team May Create Less xG by Choice
Imagine at half-time it is Team A 2-0 Team B, with Team A producing 1.7 first-half xG. In the second half, Team A creates only 0.5 xG. That does not necessarily indicate deterioration—the team no longer needs another two goals, and the tactical priority has changed. This is particularly relevant in Champions League matches where preserving three points or protecting an aggregate lead matters more than maintaining attacking volume.
Losing Teams Can Inflate Their Second-Half xG
Now reverse the situation. Team B trails 0-1 at half-time and produces 0.35 first-half xG followed by 1.40 second-half xG. That looks like dramatic improvement, but part of the increase may simply come from necessity: the team had to attack, full-backs moved higher, and more players entered the penalty area. Before using the 1.40 as evidence of future second-half strength, ask: Does this happen when the score is level too?
Score-Adjusted Splits Are Better
Ideally, you would separate a team’s attacking numbers by game state:
Second-half xG while level: 0.70
Second-half xG while losing: 1.35
Second-half xG while winning: 0.45
Now the pattern makes much more sense. The team is not simply a “second-half team”—its attacking output changes according to what the score requires.
Substitutions Are One Reason Second-Half xG Can Rise
Modern football allows managers to change large parts of a team during the second half. Fresh attackers facing defenders who have already played 60–75 minutes can change one-on-one speed, pressing intensity, movement behind the defence, and counterattacking quality.
The 2024 five-league study found that second-half substitutions were associated with increased goal activity. Understanding how substitutions increase the chance of late goals highlights why squad depth matters: a team with elite attacking options on the bench may have much stronger second-half potential than one whose level falls sharply after changes.
Check Who Is Producing the Second-Half xG
Suppose Team A has excellent second-half numbers. Why? Maybe its strongest winger frequently starts on the bench, perhaps its striker only recently returned from injury, or maybe the numbers were generated because the team repeatedly fell behind. Always investigate the source—statistics describe behaviour, but they do not automatically explain it.
Fatigue Can Increase Late Chances
Defensive concentration and physical capacity can decline as matches progress. Research on large football datasets has repeatedly found more goals occurring during second halves, with fatigue and increasingly offensive behaviour among the possible explanations. This can produce slower recovery runs, more space between midfield and defence, poorer marking, and more transition chances—especially in high-intensity Champions League matches.
But Do Not Assume Every Defence Weakens Late
Some teams have excellent squad depth, strong game management, defensive substitutes, and the ability to slow possession. A team may actually become harder to score against once it takes the lead. UEFA highlighted Arsenal doing exactly this against Inter in 2025/26 when Mikel Arteta introduced Declan Rice while leading 2-1 to add defensive cover. Second-half xGA should always be interpreted alongside tactical substitutions.
First-Half xGA Can Reveal Vulnerable Starters
On the defensive side, suppose Team B concedes 1.05 first-half xGA and 0.65 second-half xGA. This may indicate slow starts, problems dealing with early pressing, or poor initial defensive organisation—strengthening Opponent First-Half Team Total or Over 0.5 First-Half Goals predictions. Always check whether several first halves were distorted by penalties or red cards.
Second-Half xGA Can Reveal Late Vulnerability
The reverse can be even more useful. Imagine a team allows 0.60 first-half xGA and 1.25 second-half xGA due to fatigue, a weak bench, losing midfield control, opponents taking more risks, or failing defensive substitutions. If the upcoming opponent is also a strong second-half attacking side, the matchup becomes interesting.
Practical Matchup Example
Team A attack: First-half xG 0.60, Second-half xG 1.25
Team B defence: First-half xGA 0.55, Second-half xGA 1.15
Here there is clear alignment: Team A becomes more dangerous after the break, while Team B allows more chances. That provides a stronger basis for Second Half Over 1.5 Goals than simply looking at recent final scores.
Compare the Two Teams’ Splits Together
A useful approach is creating a simple matrix:
| Metric | Home | Away |
| First-half xG | 0.95 | 0.60 |
| First-half xGA | 0.55 | 0.90 |
| Second-half xG | 0.85 | 1.20 |
| Second-half xGA | 1.00 | 0.75 |
This suggests the home side may have the stronger first-half opportunity, while the away side may become more dangerous after the break. Instead of one generic full-match prediction, you now have a possible match script.
Full-Match xG Can Hide That Script
Imagine the expected final totals are 1.8 Home xG and 1.8 Away xG. The full-match numbers make the teams look identical. But if the split shows Home (1.2 first half / 0.6 second) and Away (0.5 first / 1.3 second), that changes first-half markets, half-time/full-time analysis, live betting expectations, and the timing of goal predictions.
The Current Champions League Is Already Highly Productive
The first four matchdays of the 2026/27 Champions League produced 291 goals in 72 matches for an average of about 4.05 goals per game. That makes goal timing especially interesting, though a high competition-wide average does not tell you whether your chosen fixture is more likely to produce goals before or after half-time. Team-specific xG splits provide that additional detail.
Late Goals Have Been a Recurring Champions League Feature
UEFA’s 2024/25 league-phase analysis found that the most productive scoring period was 76–90 minutes, with almost a quarter of all goals—23%—arriving after the 75th minute including added time. This does not mean betting a late goal in every Champions League match, but it supports investigating teams whose own second-half xG profiles are already strong and applying principles for how to predict late goals after the 75th minute.
Qualification Pressure Can Widen the Difference
Late in the league phase, a team may know that a draw is not enough. If the first half is cautious and finishes 0-0, the strategic incentive changes as time disappears. The manager may add an attacker, move full-backs higher, increase pressing, and accept counterattacking risk—causing second-half xG to rise sharply. This makes Champions League Matchdays 6–8 particularly interesting for half-by-half analysis.
Knockout Matches Need Even More Context
In a second-leg knockout match where Team A trails 0-2 on aggregate, its second-half xG history matters far less than the immediate aggregate scenario. If it remains 0-0 at half-time, Team A must eventually take substantial risks. Conversely, a team leading 3-0 on aggregate may see its second-half attacking numbers collapse because it has no reason to chase goals.
Red Cards Can Ruin the Sample
Suppose a team’s last five second-half xG totals are 0.8, 0.9, 2.7, 0.7, and 1.0. The 2.7 looks exceptional—until you discover the opponent received a red card in the 48th minute. Do not treat the average as normal. The same applies to penalties, severe game-state distortions, and extra-long added time.
Sample Size Is a Major Problem
If a team has played five Champions League matches, you only have five first halves and five second halves—a classic example of small sample sizes in football statistics. One 3.0-xG second half can dramatically change the average. For better analysis, combine the current Champions League split with domestic splits, longer-term European data, and tactical evidence.
Use Rolling Half-by-Half xG
Instead of one season average, track recent direction using detailed shot-timing databases like Understat. For example, a second-half xG sequence of 0.55, 0.70, 0.88, 1.02, 1.18 may indicate increasing attacking effectiveness after the break, whereas 1.30, 1.10, 0.90, 0.65, 0.50 could show deterioration. Always investigate why—whether substitutes changed, a striker was injured, or the tactical approach shifted.
Do Not Double Count Related Statistics
High second-half xG, high second-half shots on target, and many second-half big chances are useful signals, but they are closely related. Do not treat them as three completely independent reasons; use them for confirmation rather than artificially inflating confidence.
How First-Half xG Can Help Over 0.5 HT Predictions
A strong first-half case might include:
Home first-half xG above 0.9
Opponent first-half xGA above 0.8
Strong early shots-on-target numbers
Full-strength attackers and an aggressive tactical setup
That gives you several connected reasons for an early goal, which is far more informative than simply noting a team has four first-half goals in its last five matches.
How Second-Half xG Can Help Over 1.5 Second-Half Predictions
Look for both teams’ second-half xG, second-half xGA, strong attacking benches, tactical need for victory, and weak defensive depth. If Home 2H xG is 1.15, Away 2H xG is 1.05, both allow 1.0+ second-half xGA, and a draw does not strongly benefit either side, the case becomes much more interesting.
A 0-0 Half-Time Score Is Not Automatically an Under Signal
This is one of the biggest live-prediction mistakes. A match reaches half-time at 0-0, and some bettors immediately expect an Under. Understanding how to predict a scoreless first half versus reading a live 0-0 requires checking the underlying chances: if first-half xG was 1.2 Home and 0.9 Away (2.1 combined xG), the chances arrived even if the goals did not. Compare that with a 0-0 featuring 0.45 combined xG—a very different match.
A High-Scoring First Half Does Not Guarantee More Goals
Suppose the half-time score is 2-1. Over 3.5 may look tempting, but if those three goals came from 0.8 combined xG, scoring is already far ahead of the chances. If the leading team is happy with the result, second-half attacking risk could decline. Do not assume first-half goals automatically reproduce themselves after the interval.
Twin Goals Can Create Rapid Game-State Changes
The Champions League can also produce goals in clusters. UEFA found 61 instances during the 2025/26 league phase where one goal was followed by another within five minutes. These quick follow-up goals accounted for 21% of the overall total scored, and in 60% of those cases the same team scored again. One goal can force an immediate tactical reaction that creates another, making the period immediately after a goal worth close attention in live predictions.
First-Half vs Second-Half xG Checklist
Before using half-split xG, check:
First-half xG, First-half xGA, Second-half xG, and Second-half xGA
Shots on target and big chances by half
Score at half-time in previous matches (winning or losing)
Strength of opposition and home-away context
Half-time tactical changes and quality of substitutes
Red cards, penalties, and whether one extreme match distorts the average
Current table or aggregate situation
Most importantly, ask: Is the difference between halves a genuine team tendency—or simply the result of game state?
Frequently Asked Questions
What does first-half xG mean? First-half xG is the total expected-goal value of the chances a team creates before half-time. It can help measure whether a team consistently creates dangerous opportunities early in matches.
Are more Champions League goals scored in the second half? Historically, second halves have often produced more goals. UEFA reported more second-half than first-half goals in the 2023/24 group stage, while 23% of 2024/25 league-phase goals arrived after the 75th minute.
Does high second-half xG mean a team is better after half-time? Not necessarily. The team may frequently be losing and therefore forced to attack. Check game state, substitutions and tactical changes before drawing that conclusion.
Can first-half xG improve Over 0.5 First-Half predictions? It can help. It is most useful when strong first-half xG is supported by shots on target, big chances and an opponent that also allows substantial first-half xGA.
Why can xG change so much after half-time? Half-time substitutions, tactical adjustments, fatigue and scoreline pressure can all change chance creation. UEFA highlighted Juventus moving from 0.37 first-half xG to 1.02 after tactical changes against Benfica in 2025/26.
Final Thoughts
Full-match xG is one of the most useful statistics in football prediction, but sometimes it hides the most interesting part of the story: when the chances are being created. Two teams can both average 1.8 xG and still have completely different match profiles—one starting fast, the other becoming dangerous after half-time.
Start by comparing 1H xG and 1H xGA, then 2H xG and 2H xGA, using shots on target and big chances to confirm the pattern. After that, investigate half-time scores, substitutions, tactical changes, and competition context. Competition-wide trends like UEFA’s late-scoring data are only the background; the real value comes when the individual teams tell the same story.
The strongest question is not “Does this team score more in the first or second half?” Ask: “Does its chance creation genuinely change between halves, and can I explain why?” Once you can answer that, half-by-half xG becomes a way to understand the likely timing and shape of a Champions League match.
Responsible betting: First-half and second-half xG can help identify match patterns but cannot guarantee when goals will arrive. Combine split data with game state, team news, tactical context and available odds, keep stakes controlled and never bet money you cannot afford to lose.