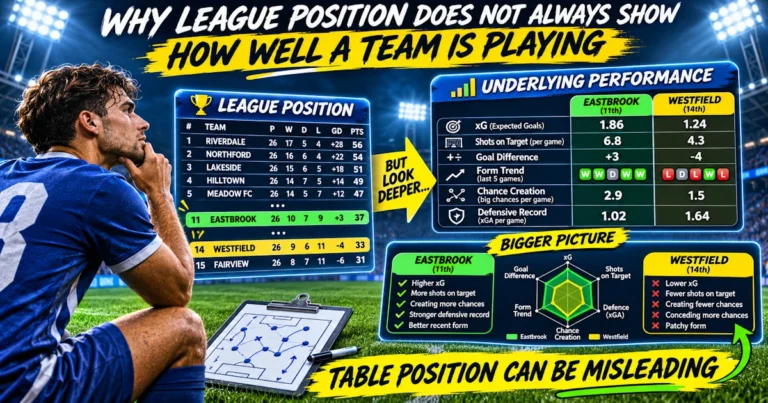
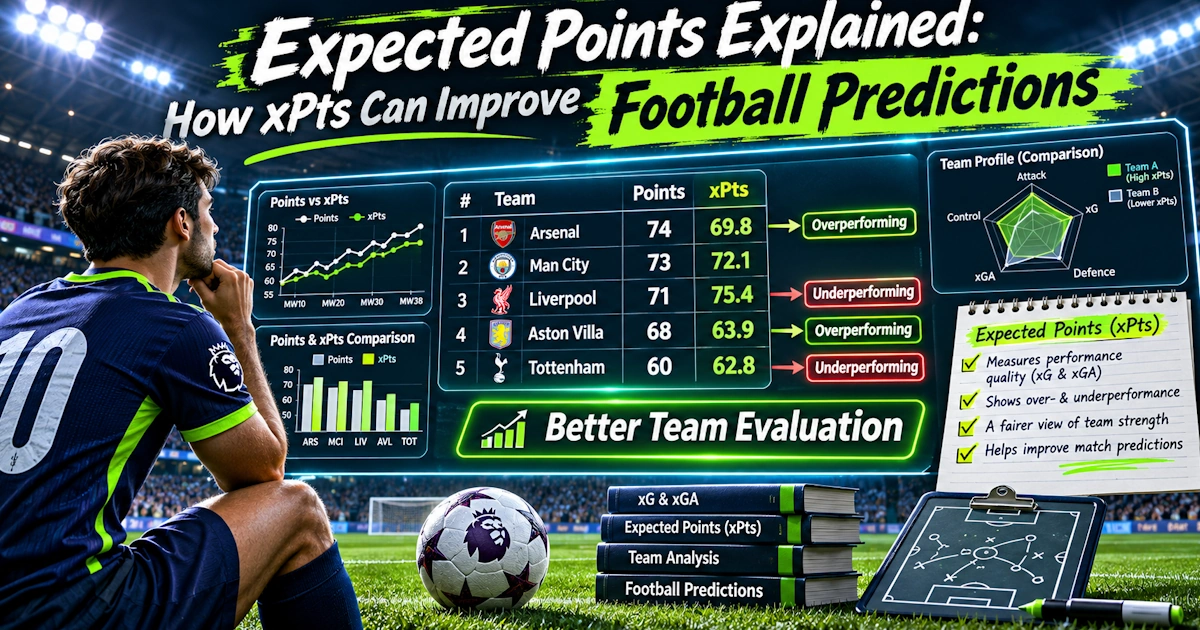
The league table tells you how many points a football team has collected. Expected points tries to answer a different question: How many points did the team’s performances suggest it might have collected?
That difference can be extremely useful for football predictions.
A team can win three matches while repeatedly being outplayed. Another can lose several games despite creating better chances than its opponents. The first team moves up the table. The second moves down. But if you are trying to predict what happens next, the underlying performances may tell you something the league table does not.
That is where expected points, commonly written as xPts, becomes useful. It is not an alternative league table that tells us where teams “really deserve” to be. It is a performance measure designed to reduce some of the noise created by finishing, goalkeeping and the randomness of individual match results. Used correctly, xPts can help identify teams whose league position may be stronger—or weaker—than their performances suggest.
What Are Expected Points?
Expected points estimate how many league points a team could expect from the chances created and conceded in a match. The calculation normally starts with Expected Goals (xG).
Suppose a match finishes Team A 1-0 Team B, but the xG totals are Team A 0.8 xG and Team B 2.0 xG.
The real league table gives Team A 3 points and Team B 0 points. An expected-points model looks at the quality and quantity of those chances and estimates how often each team would win, draw or lose if similar opportunities were converted repeatedly.
Opta’s xPts model does this by using the xG value of every shot to simulate the match 10,000 times. Expected points are then calculated from the proportion of simulations ending in wins, draws and defeats.
How Is xPts Calculated?
The basic logic is easier than it sounds. Imagine a simulation produces:
Win: 50%
Draw: 30%
Loss: 20%
Football awards three points for a win and one for a draw. So the expected-points calculation becomes: (0.50 × 3) + (0.30 × 1) + (0.20 × 0) = 1.80 xPts
The team did not literally earn 1.8 points. That is impossible in the actual competition. It means that given the chances created and conceded, similar performances would be expected to produce around 1.8 points on average.
xPts and xG Are Not the Same Thing
Expected goals measures chance quality. Expected points attempts to convert those chances into match-outcome probabilities.
Consider:
Team A: 1.6 xG
Team B: 1.3 xG
Simply subtracting the numbers gives +0.3 xG difference. But that does not directly tell you how likely Team A was to win. A 1.6-1.3 xG match can still realistically finish 0-1, 1-1, 2-1, 1-2 and many other scores.
An xPts model uses the individual chances to estimate the probability of each team winning or drawing. That makes xPts particularly useful when you want to move from “Who created better chances?” to “How strong were the performances in terms of earning results?”
Why Actual Points Can Be Misleading
Football is a low-scoring sport, making individual moments enormously important. Imagine Team A creates 0.7 xG and wins 1-0. Team B creates 2.3 xG but misses several excellent opportunities.
The table remembers only 3-0 in points. The expected-performance numbers remember something else. If Team A repeatedly wins matches while creating fewer and worse chances than its opponents, you should investigate whether those results are sustainable. Likewise, a team losing matches despite consistently producing positive xG numbers may be stronger than why the league table can be misleading early in the season.
A Practical xPts Example
Imagine two teams after ten league matches.
Team A
Actual points: 22
Expected points: 15.8
Team B
Actual points: 13
Expected points: 18.2
The league table says Team A has been nine points better. xPts tells a very different story. Team A has collected around 6.2 points more than its expected performance. Team B has collected around 5.2 points fewer.
This does not mean Team B should automatically be favourite when they meet. But the nine-point table gap deserves much less weight than it would at first glance. That is exactly how xPts can improve prediction analysis.
xPts Can Help Identify Overperforming Teams
Suppose a team has won five of its last six matches. That sounds excellent. But the six matches produced 16 actual points and only 9.7 xPts.
Now investigate why. Perhaps the team has scored several low-probability shots, benefited from outstanding goalkeeping, won multiple close games, or finished chances at an unusually high rate. None of those automatically means the team will collapse, but the results may be making its form look stronger than the underlying performance.
If the betting market begins pricing the team as though the winning streak represents a major improvement in quality, xPts can provide a useful warning.
xPts Can Also Identify Underperforming Teams
The opposite is often more interesting. Imagine the last six matches show 1 win, 2 draws, 3 defeats. Poor form. But the actual points are 5 and the xPts are 10.4.
The team has consistently created enough chances to produce better results. Maybe its striker missed several big chances, opponents scored from difficult shots, or the goalkeeper made mistakes. If the performances remain strong, the market may eventually become too negative because bettors focus on the visible results.
That is where xPts becomes valuable. It can help distinguish bad results from bad performances.
Real Football Can Produce Huge xPts Gaps
Large differences between real and expected points do occur. In the 2025/26 Championship, Hull City collected 73 actual points, while Opta’s model estimated only 53.1 xPts. Their +19.9-point overperformance was the largest in the division.
That does not prove their real points were somehow invalid. They earned them. But if you were trying to estimate future performance, a gap of almost 20 points would certainly deserve investigation. It asks an important question: What allowed the team to outperform its underlying chance data by so much, and is that advantage repeatable?
Do Teams Eventually Return to Their xPts?
Not necessarily. This is where expected statistics are frequently misunderstood.
Suppose a team has 25 actual points but only 19 xPts. It does not now “owe” six points to the football universe. It does not have to lose enough future matches to return exactly to its expected total. That would be a version of the gambler’s fallacy.
The useful prediction idea is different. If the team’s underlying performances remain equivalent to approximately 1.5 expected points per match, you should not automatically expect it to continue earning 2.0 actual points per match. Past overperformance has already happened. Future probabilities start again.
This mirrors the relationship between expected goals vs actual goals; prior overperformance does not have to be reversed by equivalent future underperformance.
Some xPts Overperformance Can Be Genuine Skill
This is important because xPts is not perfect. Suppose a team consistently earns more points than expected. That may partly reflect qualities not fully captured by the model. Examples include elite finishing, excellent goalkeeping, intelligent game management and tactical behaviour when protecting a lead.
A 2025 study examining expected performance across the top seven European men’s leagues estimated that roughly 40% of the variation in seasonal over- or underperformance was attributable to persistent skill, while approximately 60% was attributed to luck. The researchers estimated standard deviations of roughly six league points from skill and seven from luck across a 38-game season.
That is a useful warning against blindly betting against every xPts overperformer. Ask why the gap exists.
Luck Can Still Move Teams Several League Positions
The same study found that random variation could have a meaningful effect even across a full season. Its simulations suggested luck changed a team’s league ranking by an average of approximately 1.8 positions.
That is substantial. It helps explain why the final league table, while perfectly accurate in terms of points earned, may not perfectly rank the underlying performance quality of every team. For football predictions, that distinction matters because your job is not to reproduce yesterday’s table. Your job is to estimate tomorrow’s probabilities.
xPts Is Particularly Useful in Small Samples
Suppose a team starts the season with four victories from five matches (W-W-W-L-W). Very impressive. But five matches are a tiny sample. One penalty, deflection or goalkeeper mistake can dramatically change the points total.
xPts allows you to ask whether those early victories were supported by performances. If the team collected 12 actual points from only 6.5 xPts, you might remain cautious. If it collected 12 actual points from 11.2 xPts, the strong start appears much better supported.
Strength of Schedule Still Matters
Expected points improve league-table analysis, but they do not solve every problem. Suppose two teams both average 1.7 xPts per match.
Team A faced: 1st, 3rd, 5th, 6th, 8th
Team B faced: 15th, 17th, 18th, 19th, 20th
Those 1.7 xPts averages are not necessarily equally impressive. Team A achieved its numbers against much stronger opposition, showing why football form needs context. A particularly interesting team may be one that has strong xPts, difficult recent opponents, and easier upcoming fixtures.
Home and Away xPts Can Reveal Useful Splits
Overall xPts can hide important differences. Suppose a team averages 1.55 xPts overall, but has 2.05 home xPts and 1.05 away xPts. If the next game is away, the overall number may overstate the team’s expected performance.
Like xG, xPts becomes more useful when you compare it with the conditions of the next match, particularly when assessing home and away form. But be careful with small samples; after only four home matches, one unusual game can still distort the average.
Red Cards Can Distort Expected Points
Imagine a team receives a red card after 15 minutes. Its opponent then creates 3.0 xG and dominates the match. The xPts model naturally reflects those chances. But for predicting the next match at 11 versus 11, the result deserves context.
The same applies when an opponent receives an early red card. A huge xPts advantage may have been created under unusual conditions. Do not mechanically copy xPts numbers into your next prediction. Investigate how they were generated.
Game State Is One of xPts’ Limitations
A team leading 2-0 may deliberately stop attacking. Its opponent then dominates possession and creates several chances. The final xG and xPts figures may make the match appear more balanced than it felt when the outcome was genuinely uncertain.
Opta specifically notes that its expected-points model does not fully account for game state, nor does xG capture dangerous attacking situations that never result in a shot. That is why xPts should support match analysis, not replace it.
xPts Does Not Capture Every Dangerous Attack
Imagine a winger beats the defensive line and sends a perfect low cross across an empty six-yard box. The striker misses contact by centimetres. No shot occurs, therefore no xG is recorded.
If the attack creates no shot, a standard xPts model based on shot xG cannot reward it directly. Another team may repeatedly create these dangerous situations. Its true attacking performance may be slightly better than its xPts numbers suggest. Watching football and understanding tactics still matters.
Finishing Quality Matters
Suppose Team A repeatedly produces 1.5 xG and scores 2.0 goals per match. Is it lucky? Maybe. But what if it has several elite finishers? Some degree of persistent xG overperformance can be genuine skill.
The same applies to expected points. A team with outstanding attackers and an elite goalkeeper may repeatedly convert balanced performances into slightly better results than a basic chance model predicts. The correct approach is not “Actual points above xPts = lucky.” It is “Actual points above xPts = investigate the reason.”
xPts Can Improve Match-Winner Predictions
Imagine:
Team A: League position 6th, Actual points 24, xPts 18
Team B: League position 12th, Actual points 17, xPts 22
Casual analysis sees 6th vs 12th. Deeper analysis sees two teams whose underlying performances may be much closer—and possibly reversed.
Now add venue, injuries, strength of schedule, recent xG, and odds. Perhaps Team A is offered at 1.60 (62.5% implied probability). If your deeper analysis suggests only a 52% win probability, the favourite may offer poor value despite its superior league position. This is how xPts becomes useful for betting: not by telling you what to bet, but by encouraging you to question the market’s assumptions.
xPts Can Help With Goal Markets Too
Expected points are mainly a result-based performance metric, but the components behind them can also improve Over/Under analysis.
Suppose a team has high xPts because it creates strong xG and allows very little xGA. That might point towards strong win probability but not necessarily Over 2.5. Another team could have reasonable xPts while creating 2.0 xG and conceding 1.8 xGA. Its matches may be much more suitable for goal markets. Do not use xPts alone for Over/Under predictions; look at the attacking and defensive numbers underneath it.
Rolling xPts Can Show Direction of Travel
Season-long expected points are useful, but recent rolling xPts can reveal change. Imagine a team’s five-match rolling xPts per game moves: 1.05 → 1.18 → 1.39 → 1.57 → 1.74. The league position may not have moved much yet, but underlying performance has.
Now reverse it: 1.90 → 1.78 → 1.61 → 1.42 → 1.20. The team may still sit high in the table because of earlier results, but its current performance is deteriorating. Combining rolling xPts with rolling averages in football can help identify these changes sooner.
Compare Actual Points With xPts, Not xPts Alone
One of the simplest ways to use the metric is Actual Points − Expected Points.
Team A: 25 actual points, 18 xPts (Difference: +7)
Team B: 15 actual points, 21 xPts (Difference: -6)
These gaps do not automatically mean Team A will fall and Team B will rise. They tell you where further investigation is worthwhile. A large gap is a question, not an answer.
What Makes an xPts Gap More Convincing?
An underperforming team becomes particularly interesting when several metrics agree. For example: actual points below xPts + positive xG difference + more shots on target than opponents + difficult recent schedule. Now there is a broader performance story.
Likewise, a high-flying team deserves more caution when actual points greatly exceed xPts while xG difference is weak, shots on target are negative and the schedule has been easy. The strongest analysis comes from agreement between several indicators.
xPts Prediction Checklist
Before using expected points for a football prediction, check:
Actual points versus xPts and the size of the sample
xG and xGA behind the xPts total
Recent rolling xPts and strength of schedule
Home-away split
Red cards, penalties, and game-state effects
Finishing quality and goalkeeper performance
Injuries, lineup changes, and manager tactics
Whether several other metrics support the same conclusion
Whether the betting odds already reflect the underlying improvement or decline
Expected points work best as part of a wider model rather than a standalone betting system.
Frequently Asked Questions
What does xPts mean in football? xPts means expected points. It estimates how many points a team’s chances created and conceded would typically produce based on the probabilities of winning, drawing and losing.
How does Opta calculate expected points? Opta uses the xG value of every shot and simulates each match 10,000 times. The proportion of simulated wins, draws and losses is then converted into expected points.
Is xPts better than the real league table? No. Real points decide league positions. xPts serves a different purpose: it helps analyse whether results are supported by underlying chance creation and prevention.
Does a team above its xPts total have to start losing? No. Past overperformance does not have to be reversed. Some of the difference may also reflect genuine finishing, goalkeeping or tactical skill rather than luck.
Can xPts improve betting predictions? It can provide useful information by identifying teams whose results may not match their underlying performances. However, xPts should be combined with opponent strength, team news, xG, venue and betting odds rather than used as a standalone betting system.
Final Thoughts
Expected points are useful because football results can be noisy. A team can win despite creating very little. Another can dominate and lose. Repeat that process over several matches and the league table can temporarily give a misleading impression of how well the teams are actually performing.
xPts helps us look underneath those results. It asks: Given the chances this team created and conceded, how often would these performances normally produce wins, draws and defeats? That is valuable information.
But xPts should never become another statistic that is followed blindly. The model depends on xG. It cannot capture every dangerous attack. Game state matters. Elite finishing and goalkeeping can create genuine, persistent differences between expected and actual performance. And strength of schedule still needs to be considered.
The most useful approach is therefore to compare actual points, expected points, xG difference, opponent quality, and current team context. When the real table and xPts table tell similar stories, confidence in the team’s level increases. When they disagree dramatically, investigate.
That disagreement may reveal a team whose results are stronger than its performances—or a struggling side whose football is considerably better than its league position suggests. For prediction purposes, that is the real value of xPts. It does not tell you what should have happened. It helps you estimate whether what has happened is a reliable guide to what may happen next.
Responsible betting: Expected points can improve performance analysis but cannot guarantee future results. Use xPts alongside xG, opponent strength, team news and the available odds, keep stakes controlled and never bet money you cannot afford to lose.