A football team wins six of its last seven matches. It sits higher in the league table than expected. Its striker cannot stop scoring. The goalkeeper keeps producing clean sheets. Everything looks excellent.
But then you check the underlying statistics. The team has scored 15 goals from 9.5 xG, conceded only 6 from 11.8 xGA, and collected 18 points from 11.5 xPts.
Suddenly the picture becomes more complicated. The results are real. The points are real. Nobody is taking the goals away. But the performances may not support results at the same extraordinary rate forever.
This is what we mean when we say a football team may be overperforming its statistics. For predictions, identifying these teams can be extremely useful because betting markets, media coverage and public opinion often react strongly to recent results.
The important question is not: “Has this team been lucky?” It is: “Which parts of its performance are repeatable, and which numbers are running unusually far ahead of the underlying process?”
What Does Overperformance Mean in Football?
Overperformance occurs when actual results exceed what underlying performance statistics would normally suggest.
The simplest examples are:
Goals scored > xG
Goals conceded < xGA
Actual points > xPts
Suppose a team has Goals: 24, xG: 17. It has scored approximately 7 goals above expectation. Or Actual points: 30, xPts: 22. It has collected 8 more points than its shot-based performances would typically suggest.
Neither number proves the team is about to collapse. It simply tells you where deeper analysis is needed.
Start With Goals Versus xG
This is one of the easiest overperformance indicators to check. Expected goals (xG) estimates the probability of chances becoming goals. If a team consistently scores significantly more than its xG, it is converting opportunities at a higher rate than the model expects.
For example:
Team A: Goals 20, xG 13.5 (Difference: +6.5)
Team B: Goals 17, xG 16.8 (Difference: +0.2)
Team A’s scoreboard looks more impressive. Team B’s scoring is much closer to its underlying chance creation. For future predictions, Team A deserves investigation.
A Current Premier League Example
Early in the 2026/27 Premier League season, Brighton scored 24 goals from 17.2 xG, an overperformance of 6.8 goals. Chelsea had scored 19 from 13.3 xG, roughly 5.7 above expectation.
Those numbers do not mean either attack is poor. Brighton, for example, also had one of the league’s highest xG totals.
The important distinction is: strong chance creation + exceptional finishing is different from ordinary chance creation + exceptional finishing. The first can remain a strong attack even if finishing cools. The second may be much more vulnerable to regression.
Separate Good Attack From Hot Finishing
Consider two teams.
Team A: Goals 22, xG 19
Team B: Goals 22, xG 13
Both scored 22. But their underlying attacks are very different. Team A would still look strong if finishing moved closer to expectation. Team B might lose much more of its scoring output. This is why raw goals are not enough, emphasizing exactly why analyzing expected goals vs actual goals is essential. Ask: How much attacking performance remains if the extraordinary finishing disappears?
Check Non-Penalty xG Too
Penalties can inflate both goals and xG. Suppose a team has 18 goals from 15 xG, but four penalties contributed roughly three expected goals. Its non-penalty attacking profile may be more ordinary than the headline number suggests.
When comparing attacks, check: Total goals, Total xG, Non-penalty goals, and Non-penalty xG. A team repeatedly winning penalties may have genuine attacking qualities that create them. But penalties remain relatively infrequent events, so separating them can reveal how much threat is coming from normal attacking situations.
Look at Conversion Rate
Another warning sign is an unusually high shot-conversion rate.
Team A: 100 shots, 20 goals (Conversion: 20%)
Team B: 100 shots, 11 goals (Conversion: 11%)
Team A may genuinely have better finishers. But if its normal historical rate is around 11–13%, the sudden jump to 20% deserves attention.
Then check: Has shot quality improved too? If xG per shot has risen sharply, the higher conversion may be partly justified. If shot quality remains unchanged, the scoring surge may be less sustainable.
High Finishing Does Not Automatically Mean Luck
This distinction matters. Elite finishers can repeatedly outperform average xG expectations. Teams can also create situations that generic models do not capture perfectly.
A 2025 study covering the top seven European men’s leagues across three seasons examined deviations from expected goals and expected points. The researchers estimated that approximately 40% of the overall variation in over- and underperformance was attributable to persistent skill, while roughly 60% was associated with luck or random variation.
So: overperformance ≠ automatically lucky. The correct response is: investigate whether there is a repeatable reason for it.
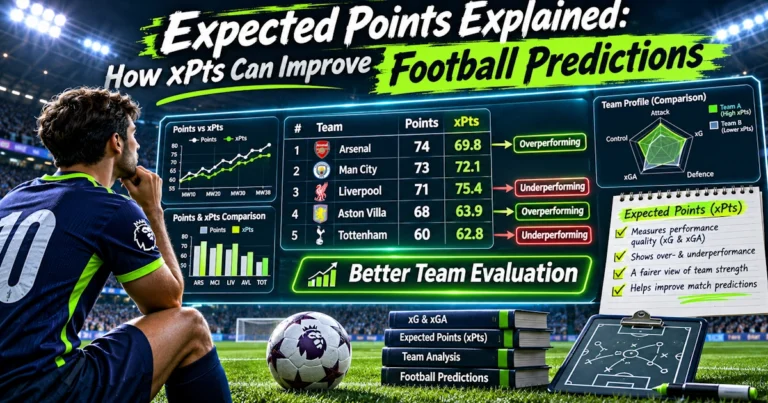
Expected Points Can Reveal Result Overperformance
Goals versus xG tell you about finishing. Expected points (xPts) can reveal something broader.
xPts attempts to estimate how many points a team’s chances created and conceded would normally produce. Opta’s model uses the xG value of each shot, simulates each match 10,000 times, and derives expected points from the proportions of simulated wins, draws and defeats.
Suppose Actual points are 25 and xPts are 17 (Difference: +8). That is a significant gap. The team has converted its performances into considerably more points than expected. Now ask why.
One-Goal Wins Can Drive xPts Overperformance
Imagine a team’s recent wins are: 1-0, 2-1, 1-0, 2-1, 1-0. Five victories. Fifteen points.
But each match was relatively balanced in chances. The team may have finished important moments well, defended leads effectively, benefited from strong goalkeeper performance, or experienced favourable variance. Winning close matches is valuable. The question for predictions is whether the same team can keep converting balanced matches into victories at an unusually high rate.
A Real xPts Example
Hull City provided a striking recent example. In the 2025/26 Championship, Hull collected 73 actual points while Opta’s expected-points model estimated 53.1 xPts. Their +19.9-point gap was the largest in the division.
Those 73 points were completely legitimate. But for forecasting the team’s future level, the almost 20-point difference was important information. It suggested that their final league position alone might overstate what the underlying performances indicated.
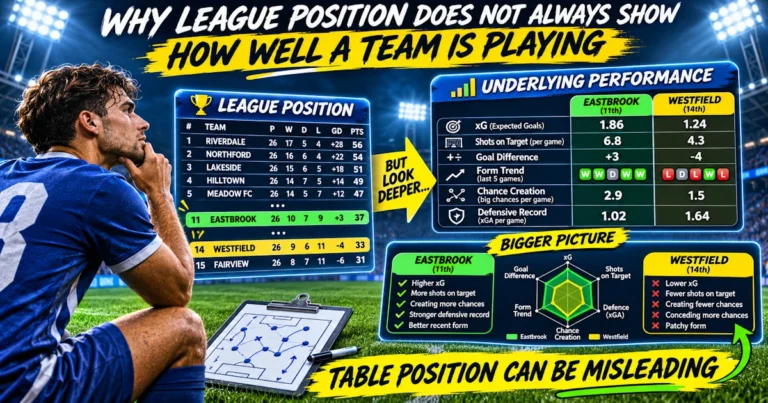
League Position Can Therefore Mislead
Suppose:
Team A: 5th place, 27 points, 20 xPts
Team B: 12th place, 19 points, 24 xPts
The table says Team A has been eight points better. Expected performance tells a different story.
Now imagine Team A is priced at 1.55 when the teams meet. The market may be partly reacting to visible league position. Your job is to determine whether the underlying gap justifies such a strong favourite price. This demonstrates exactly why the league table can be misleading.
Check Goals Conceded Versus xGA
Overperformance can happen defensively too. Suppose Team A has Goals conceded 7 and xGA 14 (Difference: +7 defensive overperformance).
The team has allowed chances normally worth around 14 goals but conceded only seven. That could reflect excellent goalkeeping, poor opposition finishing, blocks and defensive interventions, or short-term variance. Do not automatically assume the defence itself is elite.
Goalkeeper Performance Can Explain Some of the Gap
Expected goals against measures the quality of shots allowed before the final shot outcome. Goalkeepers can then alter what happens.
Expected goals on target, or xGOT, helps evaluate the quality and placement of shots that actually hit the target. Opta uses xGOT to estimate how many goals an average goalkeeper would be expected to concede from those shots, helping separate goalkeeper performance from the defence in front of them.
If a team’s goals conceded are far below xGA but its goalkeeper also has excellent goals-prevented numbers, part of the overperformance may be genuine shot-stopping skill.
Clean Sheets Can Hide Defensive Problems
Imagine Team A has 5 clean sheets in 7 matches. That sounds excellent. But xGA across those seven matches is 10.2. The clean sheets may be more flattering than the underlying defending.
Now compare Team B: 3 clean sheets, but xGA 5.8. Team B may actually be preventing dangerous opportunities much more effectively. For future Under or BTTS-No predictions, Team B’s process may be more trustworthy.
Look for Several Overperformance Signals at Once
One unusual statistic is interesting. Several together are much more powerful. For example: Goals well above xG + Goals conceded well below xGA + Actual points far above xPts + Many narrow wins.
Now you have a team whose results are outperforming its underlying statistics in several ways. That deserves much more attention than simply seeing: Goals +2 above xG.
Practical Example: Classic Overperformer
Imagine after 12 matches:
Team A: Points 27, xPts 19, Goals 24, xG 17, Goals conceded 10, xGA 16. Last six: W-W-W-D-W-W.
The headline story is excellent form. The statistical story is +7 goals above xG, 6 fewer goals conceded than xGA, and +8 points above xPts. The team may still be genuinely good. But sustaining all three gaps simultaneously is a much stronger assumption. If bookmakers dramatically shorten its odds, this could be a warning.
Now Compare a Strong Team That Is Not Overperforming Much
Team B: Points 25, xPts 24, Goals 21, xG 20, Goals conceded 11, xGA 12.
Its actual results closely match its underlying numbers. That profile is often easier to trust. The team may look less spectacular than Team A. But its performance is more strongly supported by the underlying process.
Check Strength of Schedule Before Calling a Team Lucky
Suppose a team has 22 points from 16 xPts. Looks like overperformance. But it faced 1st, 2nd, 4th, 5th, and 7th during much of the sample.
Perhaps the raw xPts itself was achieved against unusually strong opposition. Its upcoming schedule is much easier. The overperformance signal still matters, but opponent strength changes the conclusion. Always use sites like Understat to ask: Who were these performances produced against?
Easy Fixtures Can Create Fake Improvement
Now reverse it. A team wins five straight against clubs ranked 17th, 18th, 15th, 20th, 16th. Goals: 14-3. The market decides: This team is flying.
But the underlying numbers are only slightly above average. Then it faces a top-four opponent. The five-match form line may tell you much less than it appears. Overperformance analysis should therefore include: results + underlying metrics + schedule quality.
Home and Away Splits Can Also Distort the Picture
Suppose a team has played six of its last eight matches at home. Its results improve dramatically. That might not be finishing overperformance at all. It may simply be a favourable venue sequence.
Check Home xG, Away xG, Home xGA, Away xGA, and the balance of recent fixtures. Before labelling a team lucky, remove obvious contextual explanations.
Penalties and Red Cards Can Inflate Results
A five-match scoring run may contain three penalties and two matches against ten men. That matters. The goals count. The points count. But they may not represent repeatable 11-v-11 attacking strength.
A useful form review should identify unusual events such as penalties, red cards, own goals, and deflections. These events are part of football. But a short sample heavily influenced by them can mislead future predictions.
Watch for Unsustainable Long-Range Scoring
Suppose a team scores four spectacular goals from outside the penalty area within three matches. Its recent goals-per-game number explodes. But long-range shots normally carry much lower xG than close-range chances.
If the team is relying heavily on 25-metre strikes, difficult volleys, and deflected shots, the scoring rate may be harder to repeat. A team consistently creating cutbacks and one-on-ones has a much stronger foundation.
Big Chances Can Confirm Whether Scoring Is Real
Suppose two teams have both scored 18 goals.
Team A: xG 12, Big chances 15
Team B: xG 17, Big chances 29
Team B’s scoring has much more support. Team A may continue scoring well if it has elite finishers. But Team B is consistently creating the sort of opportunities that can sustain goals. This is why understanding shot quality vs shot volume is crucial before labelling a team’s finishing a fluke.
Overperformance Can Be Caused by a Few Players
Sometimes the team as a whole is not overperforming. One player is.
Suppose a striker has 10 goals from 5.5 xG. The rest of the squad is roughly in line with expectation. Now imagine that striker becomes injured. Team-level historical goals may badly overstate the attack available for the next fixture. When a team’s scoring exceeds xG substantially, identify who is producing the difference.
Do Not Assume the Hot Player Must Start Missing
This is where regression to the mean is often misunderstood.
If a striker has scored 10 from 5.5 xG, he does not now owe football 4.5 missed goals. Opta explicitly notes that past xG overperformance is already “banked”; regression does not mean equivalent future underperformance must occur. The useful forecast is simply that future shots may be converted closer to the player’s normal rate.
Current Form Can Swing Dramatically
A useful recent example comes from Nottingham Forest. In one four-match spell, Forest scored 13 goals from only 4.8 xG. In another four-match stretch, they failed to score despite creating 4.5 xG. Early in 2026/27, they had just 6 goals from 14.3 xG.
That illustrates why short scoring streaks can be extremely noisy. The same team can move from extraordinary finishing overperformance to severe underperformance within a relatively short period.
Sample Size Matters
A team can dramatically outperform xG across three matches. That is not unusual. Doing it across 100 matches is a much stronger signal of persistent skill.
The 2025 European-league study found that luck was responsible for approximately 60% of variation in overall over- and underperformance, with persistent skill accounting for about 40%. It also estimated that luck could shift a team’s final league position by around 1.8 places on average. That is substantial. It is also why short samples should be handled especially carefully.
Use Rolling Averages to Spot the Change
Suppose a team’s actual goals per match are: 2.8, 2.6, 2.5, 2.3, 2.2. Meanwhile rolling xG remains: 1.5, 1.6, 1.5, 1.6, 1.5.
The goal rate is gradually moving closer to the underlying chance creation. That is useful information. Now imagine both actual goals and xG remain high. Then the attack may genuinely have improved. Rolling statistics help distinguish scoring cooling down from football performance deteriorating.
Do Not Ignore Tactical Improvement
Sometimes what initially looks like overperformance is actually the beginning of something real. Perhaps a new manager changed pressing structure, shot selection, set-piece routines, or player roles.
A team’s goals may initially run ahead of its old averages because the team itself has changed. Check whether other numbers are improving too. If xG rises, shots on target rise, and big chances rise, then the improvement has deeper support.
Expected Points Are Not a “True League Table”
If a team has 30 points and 23 xPts, do not say it “should only have 23 points.” It earned 30. Expected points answer a different question: What did the shot-based performances typically suggest?
Opta itself notes limitations in xPts, including game-state effects and dangerous periods of possession that never result in shots. Use xPts to challenge your interpretation of results. Do not treat it as an alternative reality.
Overperformance Can Still Continue
This deserves emphasis. A team can remain above xG or xPts for a long time. Reasons include elite finishing, elite goalkeeper, strong game management, effective set pieces, or model limitations.
This is why blindly betting against every statistical overperformer is a bad strategy. The 2025 research is particularly useful here: overperformance contained both skill and luck, not one or the other. Your task is to estimate the balance.
How Overperformance Can Help With Goal Predictions
Suppose a team’s last six matches produced 17 goals. The market offers Over 2.5 at 1.55. But the team created only 9.2 xG and scored several difficult long-range attempts. The recent goal totals may be inflating expectations.
Now imagine another team has scored only 8 goals from 14 xG. Its recent scorelines look quiet. But the attack is creating much more than the goals suggest. That may offer a completely different prediction opportunity.
How It Can Help With Match-Winner Predictions
Favourite: Actual points 28, xPts 20
Underdog: Actual points 18, xPts 23
The table shows a ten-point difference. The underlying data shows the opposite relationship. That does not automatically make the underdog the selection. But it should make you question whether 1.45 on the favourite is really justified.
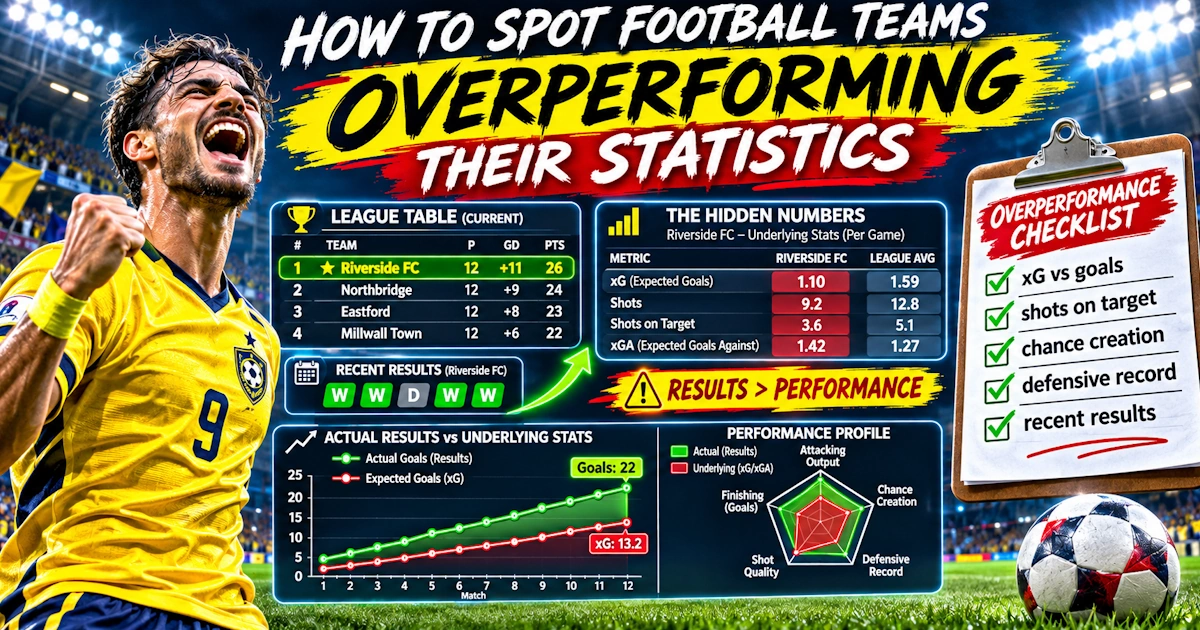
A Simple Overperformance Scorecard
You can review a team using five quick checks:
Goals vs xG: Are they scoring much more than the chances suggest?
Goals conceded vs xGA: Are opponents failing to convert good chances?
Points vs xPts: Are results significantly ahead of shot-based performance?
Close-match results: Are they winning an unusually high number of balanced games?
Context: Have schedule, penalties, red cards, injuries or goalkeeper quality explained the difference?
If four or five signals point in the same direction, overperformance deserves serious attention.
Football Overperformance Checklist
Before deciding a team is statistically overperforming, check:
Goals scored versus xG and Non-penalty goals versus npxG
Goals conceded versus xGA and Actual points versus xPts
Shot conversion, xG per shot, Shots on target, and Big chances
Goalkeeper xGOT performance and Number of narrow wins
Penalties, red cards, Strength of schedule, and Home-away balance
Sample size, Managerial/tactical changes, and Elite players
Whether bookmaker prices have already adjusted to the strong results
Most importantly: Do not look for one statistic that proves the team is lucky. Look for a pattern.
Frequently Asked Questions
What does it mean when a football team is overperforming? It means its actual outcomes—such as goals or points—are better than underlying performance measures such as xG, xGA or xPts would normally suggest.
Does scoring above xG mean a team is lucky? Not necessarily. Elite finishing can produce genuine overperformance. A 2025 study across seven European leagues estimated that persistent skill explained part of overperformance, although random variation accounted for a larger share overall.
What is the best statistic for spotting an overperforming team? There is no single best statistic. Comparing goals with xG and actual points with xPts provides a strong starting point, while goals conceded versus xGA can identify defensive overperformance.
Will an overperforming team eventually start losing? Not necessarily. Regression does not mean previous overperformance must be reversed. The team can continue winning, particularly if genuine skill explains part of the gap.
Can overperformance analysis improve football predictions? Yes. It can help identify when recent results may be stronger than the underlying performances, particularly when the betting market has reacted heavily to winning streaks, high scoring or clean sheets.
Final Thoughts
Winning matters. Goals matter. League points matter. Expected statistics do not replace any of them. What they can do is help explain how those results were produced.
A team winning six straight matches may genuinely have become excellent. Or it may be finishing far above xG, conceding far below xGA, and collecting far more points than xPts suggests. Those are very different situations.
The strongest way to identify overperformance is therefore to compare several layers: goals vs xG, goals conceded vs xGA, and points vs xPts. Then investigate the reasons behind the gap. Maybe there is an elite goalkeeper. Maybe the striker is an exceptional finisher. Maybe the team has faced an easy schedule. Maybe several narrow matches simply fell its way.
Research suggests the truth is usually a mixture: some statistical overperformance reflects repeatable skill, while a substantial share comes from random variation. That is why you should not automatically oppose a team simply because it is outperforming xG.
Instead ask: If the exceptional finishing, goalkeeping or close-match results became more ordinary, would this team still look strong? If the answer is yes, the success probably has a solid foundation. If the answer is no, the league table and recent results may be making the team look more impressive than its performances really are. For football predictions, that difference matters enormously.
Responsible betting: Statistical overperformance can help identify potentially unsustainable trends, but it cannot predict exactly when results will change. Combine xG, xPts and defensive data with team news, opponent strength and available odds, keep stakes controlled and never bet money you cannot afford to lose.