
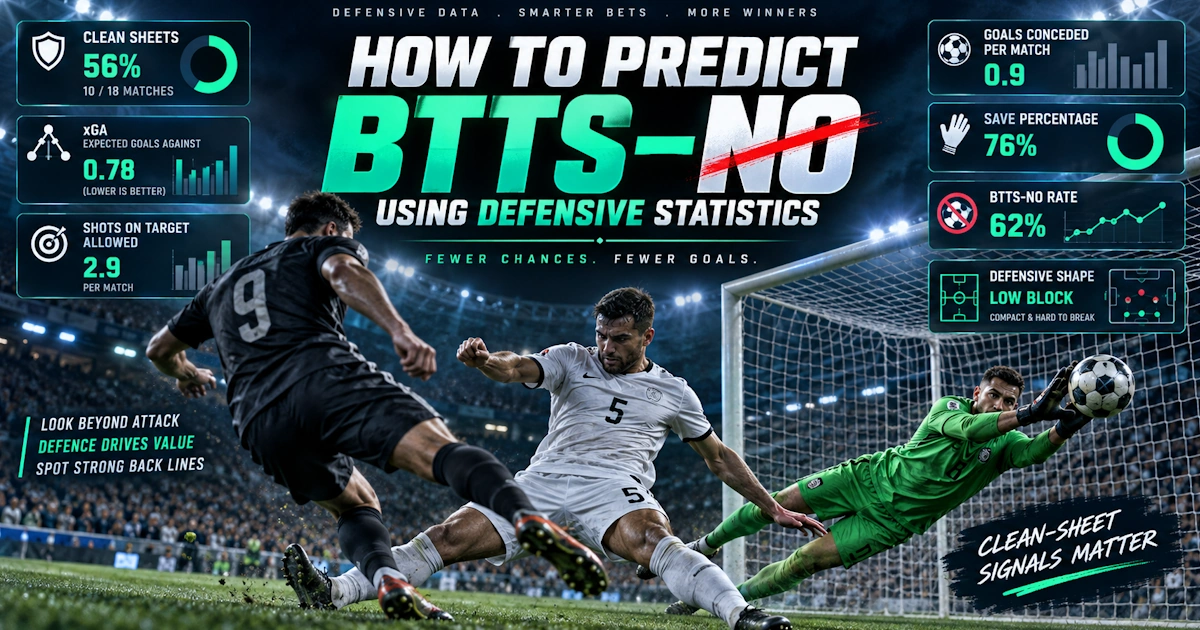
Both Teams to Score – No is often treated as the opposite of BTTS – Yes.
That sounds obvious, but the analysis should not simply be reversed.
A strong BTTS–No prediction is not about hoping one team has a bad attacking day. It is about identifying a match where there is a clear reason to believe at least one side will fail to score.
That may come from an elite home defence, a weak away attack, low expected-goals numbers, few shots on target or a tactical matchup that leaves one team with very little space.
The market can win with many different scorelines:
- 0–0
- 1–0
- 0–1
- 2–0
- 0–2
- 3–0
This is important because BTTS–No does not require a low-scoring match. A 4–0 result is still a winner.
That is why defensive statistics, combined with the weaker team’s attacking profile, are the best place to start.
Start With Clean-Sheet Percentage
Clean sheets are the most obvious defensive statistic for BTTS–No.
Suppose a home team has kept a clean sheet in 11 of 18 home matches.
That is a clean-sheet rate of approximately 61%.
Now imagine the visiting team has failed to score in 9 of 18 away matches, or 50%.
Those two statistics point in the same direction.
The home defence regularly prevents goals, while the away attack frequently produces none.
That is much stronger than simply saying the home team is “good defensively”.
For BTTS–No, always compare:
- Home clean-sheet rate
- Away clean-sheet rate
- Home failure-to-score rate
- Away failure-to-score rate
The strongest selections usually come from one side’s defensive strength matching the other side’s attacking weakness.
Failure-to-Score Rate Is Just as Important
BTTS–No only needs one team to stay scoreless.
That makes failure-to-score percentage extremely useful.
Imagine Team A has failed to score in only 10% of home matches.
Team B has failed to score in 45% of away matches.
In that fixture, BTTS–No will probably depend mostly on Team B.
You do not need Team A to keep the whole match low-scoring. Team A could win 3–0 and the bet still lands.
This is one reason BTTS–No can sometimes be better than Under 2.5.
A strong favourite against a weak attack can produce scorelines such as 3–0 or 4–0.
Those lose Under 2.5 but win BTTS–No comfortably.
Expected Goals Against Helps Test the Defence
Clean sheets are results.
Expected goals against, or xGA, helps show whether those results are supported by chance prevention.
Suppose two teams have each kept five clean sheets in their last eight matches.
Team A
- 0.70 xGA per match
- 2.5 shots on target allowed
- Few big chances conceded
Team B
- 1.55 xGA per match
- 5.5 shots on target allowed
- Goalkeeper making several difficult saves
The clean-sheet numbers are identical.
The underlying defensive quality is not.
Team A is preventing chances.
Team B may be surviving them.
For future BTTS–No bets, Team A’s clean sheets are more convincing.
A strong defensive profile usually includes:
- Low xGA
- Few shots on target conceded
- Few big chances allowed
- Strong clean-sheet frequency
When those statistics agree, the defence becomes much easier to trust.
Shots on Target Conceded Can Be a Powerful Filter
A team may concede few goals simply because opponents finish badly.
Shots on target help reveal whether the goalkeeper is being tested regularly.
As a practical guide, a defence allowing around 2–3 shots on target per match generally has a stronger BTTS–No profile than one allowing five or six.
Now combine this with the opponent’s attack.
Suppose the away side averages:
- 2.2 shots on target away
- 0.8 xG
- 0.7 goals per match
The home side allows:
- 2.4 shots on target
- 0.75 xGA
That creates a very strong low-threat matchup.
The visitor already creates little, and the home defence usually reduces opponent chances even further.
Big Chances Matter More Than Total Shots
Not all shots are dangerous.
A team may allow 15 shots but still defend well if most attempts come from outside the penalty area.
For BTTS–No, big chances and shot location can tell you more than the raw total.
Consider two defences.
Defence A
- Allows 14 shots
- Only 2 inside the six-yard box
- Few big chances
Defence B
- Allows 9 shots
- Several central opportunities
- 2–3 big chances per match
Defence A may actually be safer despite allowing more attempts.
The aim is to identify whether opponents are getting into dangerous scoring positions.
A team that forces attackers into low-quality shots is often suitable for BTTS–No even when the total shot count looks high.
Goalkeeper Statistics Add Another Layer
A strong goalkeeper can make a good defence even better.
Useful goalkeeper statistics include:
- Save percentage
- Goals prevented
- Clean sheets
- Shots on target faced
- Command of crosses
Suppose a defence already allows low xGA and few shots.
If the goalkeeper is also performing strongly, the chance of a clean sheet becomes even more convincing.
However, be careful when the goalkeeper is doing too much of the work.
If a team has several clean sheets but allows high xGA and many shots on target, the BTTS–No trend may be fragile.
The defence should ideally protect the goalkeeper rather than depend on him.
Home and Away Splits Are Essential
Overall defensive statistics can hide major venue differences.
A team may have:
- 55% clean sheets at home
- 20% away
Its overall figure might look respectable, but the home record is much stronger.
The same applies to the opponent’s attack.
Suppose an away team scores regularly overall but averages only 0.8 goals on the road.
That makes the away split much more relevant.
For BTTS–No predictions, compare:
- Home defence at home
- against
- Away attack away
(or the reverse if the visitors are the stronger defensive side).
Venue-specific statistics usually tell you more than the full-season totals.
Look for One-Sided Matchups
BTTS–No becomes especially attractive when one team is clearly stronger.
Imagine a strong home favourite with:
- 60% home clean sheets
- 0.8 home xGA
- Few shots allowed
The visitors:
- Fail to score in 45% of away matches
- Average 0.9 away goals
- Produce only 2.5 shots on target
The home side may win:
- 1–0
- 2–0
- 3–0
All three win BTTS–No.
This is often a better setup than two defensive teams, because one strong team can still create the result without depending on a 0–0.
Practical Example: Strong BTTS–No Selection
Imagine the home team has:
- Kept clean sheets in 6 of its last 10 home matches
- Allowed only 0.75 xGA
- Conceded fewer than 3 shots on target
- Allowed few big chances
The visitors have:
- Failed to score in 5 of 10 away matches
- Averaged 0.8 away goals
- Produced 0.9 away xG
- Missed their main striker through injury
The home team also has enough attacking quality to score once or twice.
Likely scorelines include:
- 1–0
- 2–0
- 3–0
This is a classic BTTS–No profile.
Practical Example: Avoiding a Misleading Clean-Sheet Team
Now imagine another team has kept four clean sheets in five matches.
That looks excellent.
But deeper data shows:
- 1.6 xGA
- 5.8 shots on target allowed
- Several big chances conceded
- Goalkeeper performing well above expectation
Its next opponent:
- Scores in 9 of 10 matches
- Averages 1.7 xG
- Produces five shots on target
The clean-sheet streak looks much less convincing.
BTTS–No would be risky because the defensive process does not support the results.
Practical Example: BTTS–No Better Than Under 2.5
Suppose a dominant favourite hosts a very weak attack.
The favourite averages 2.4 home goals but also keeps frequent clean sheets.
The visitors:
- Score only 0.6 away goals
- Fail to score in 60% of away matches
- Create only 0.7 xG
Possible scores:
- 2–0
- 3–0
- 4–0
BTTS–No wins all three.
Under 2.5 loses the 3–0 and 4–0 results.
This is why the two markets should not be treated as interchangeable.
Tactical Style Can Support the Statistics
Numbers are stronger when tactics explain them.
A good BTTS–No profile may involve:
- Compact defensive shape
- Strong central protection
- Low defensive line
- Few transitions allowed
- Good set-piece defending
- Goalkeeper comfortable with crosses
Now consider the opponent.
If it depends on counterattacks but the favourite does not leave space behind, its main attacking weapon may disappear.
Likewise, a crossing team may struggle against tall centre-backs and a goalkeeper who controls aerial deliveries.
The best defensive numbers usually have a tactical explanation.
Red Cards Can Destroy the Prediction
BTTS–No can be particularly sensitive to dismissals.
If a strong defensive team receives a red card after 20 minutes, its clean-sheet probability can change dramatically.
Likewise, if the weaker attacking team goes down to ten, BTTS–No may become stronger.
This is mostly relevant for live betting, but it is a reminder that defensive statistics describe normal conditions.
Unusual match events can override them.
Team News Matters
Before backing BTTS–No, check both defences and attacks.
Important absences include:
- Goalkeeper
- Centre-backs
- Defensive midfielder
- Main striker
- Creative midfielder
- Set-piece taker
If the team you expect to keep the clean sheet is missing two defenders, its season-long clean-sheet rate becomes less relevant.
If the weaker attack is missing its main striker, BTTS–No becomes more attractive.
Current personnel should always adjust historical statistics.
Relevant Statistical Benchmarks
There are no perfect thresholds, but practical filters can help.
A strong BTTS–No candidate may include several of these:
- Clean-sheet rate above 40–50%
- Opponent failure-to-score rate above 35–40%
- xGA below roughly 1.0
- Fewer than 3–4 shots on target allowed
- Opponent xG below 1.0
- Low big-chance numbers
- Strong venue-specific defensive record
These should not be used mechanically.
The goal is to find several defensive and attacking indicators pointing towards the same outcome.
BTTS–No Checklist
Before making a selection, check:
- Clean-sheet percentage
- Failure-to-score rate
- xGA
- Opponent xG
- Shots on target conceded
- Opponent shots on target
- Big chances conceded
- Goalkeeper performance
- Home and away splits
- Defensive injuries
- Attacking absences
- Tactical matchup
- Set-piece vulnerability
- Whether a one-sided score is realistic
Frequently Asked Questions
Is BTTS–No the same as Under 2.5?
No. A 3–0 or 4–0 result wins BTTS–No but loses Under 2.5.
What is the most useful defensive statistic?
There is no single best number. Clean sheets become much stronger when supported by low xGA, few shots on target and few big chances.
Is a high clean-sheet rate enough?
No. Check whether the team is actually preventing chances or relying heavily on its goalkeeper.
Are failure-to-score statistics important?
Very. BTTS–No only requires one team to stay scoreless, so a high failure-to-score rate can be one of the strongest indicators.
Is BTTS–No good for favourites?
It can be particularly useful when a strong favourite faces an opponent with poor away attacking numbers and a high failure-to-score rate.
Final Thoughts
Predicting BTTS–No is not simply about finding two defensive teams.
Often, the clearest selection comes from a strong defence facing a weak attack.
Start with clean sheets and failure-to-score percentages, then add xGA, shots on target, big chances and goalkeeper performance. Separate home and away data and check whether current team news still supports the historical numbers.
Most importantly, picture the likely score.
If 1–0, 2–0 and 3–0 all look realistic, BTTS–No may be a better market than Under 2.5.
The strongest predictions are the ones where one team has a clear reason to score and the other has very few realistic routes to reply.
Responsible betting: Defensive trends improve analysis but do not guarantee clean sheets. Use several indicators together, keep stakes within a fixed budget and never bet money you cannot afford to lose.