
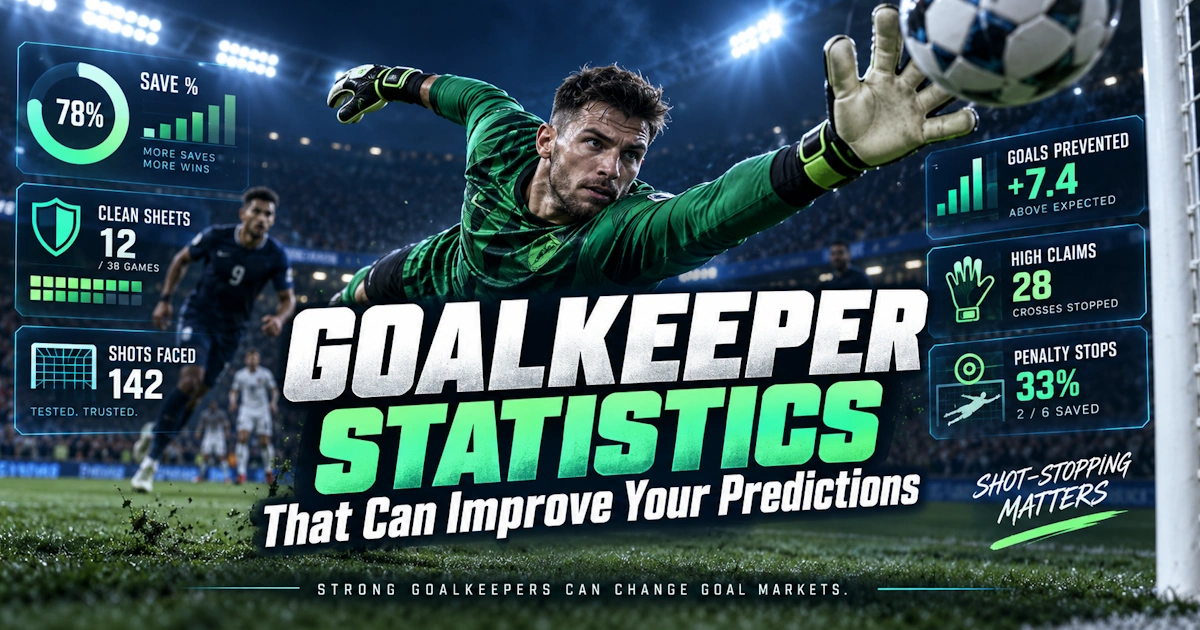
Goalkeepers are often treated as a small part of football prediction analysis.
Bettors usually focus on goals scored, xG, shots on target, team form and defensive records. The goalkeeper is sometimes mentioned only when a first-choice player is injured.
That can be a mistake.
A strong goalkeeper can keep a weak defensive performance alive. A poor one can turn ordinary chances into goals. Two teams may allow the same number of shots on target but concede very different numbers because the quality of the goalkeeping is completely different.
This is especially useful for goal markets.
If a team keeps several clean sheets while allowing plenty of dangerous shots, its defensive record may look stronger than the underlying performance. On the other hand, a team conceding regularly may actually be defending reasonably well but suffering from poor goalkeeping.
The most useful approach is to separate what the defence allows from what the goalkeeper does with those chances.
Start With Save Percentage
Save percentage is one of the simplest goalkeeper statistics.
It measures the percentage of shots on target that the goalkeeper saves.
For example, imagine a goalkeeper faces 40 shots on target and saves 30.
His save percentage is: 30 ÷ 40 × 100 = 75%
Now compare another keeper who saves 24 of 40.
That is 60%.
The difference looks significant, and it can be.
However, save percentage needs context because not every shot on target is equally difficult.
A goalkeeper facing mostly weak efforts from outside the box may naturally record a high percentage. Another facing repeated one-on-ones may have a lower percentage without necessarily performing badly.
Use save percentage as a starting point, not the final judgement.
Compare Save Percentage With Shot Quality
This is where expected goals becomes much more useful.
Suppose two goalkeepers both face 20 shots on target.
Goalkeeper A
- Concedes 3 goals
- Faces chances worth 5.5 expected goals
Goalkeeper B
- Concedes 3 goals
- Faces chances worth 2.4 expected goals
The final total is identical.
The performances probably are not.
Goalkeeper A has prevented several goals compared with the quality of chances faced. Goalkeeper B has conceded slightly more than the chances might normally produce.
This is why measures such as post-shot expected goals or goals prevented can be more informative than raw save percentage.
They attempt to account for where the shot was going and how difficult it was to stop.
Goals Prevented Can Reveal Excellent Goalkeeping
One of the most useful advanced goalkeeper measures compares the goals a keeper was expected to concede with the number actually conceded.
Imagine a goalkeeper faces shots worth 25 expected goals on target but concedes only 19.
He has prevented roughly six goals above expectation.
That is a meaningful contribution.
Now imagine another goalkeeper faces shots worth 18 expected goals but concedes 23.
He has allowed around five more goals than expected.
For goal predictions, this can be extremely valuable.
A team may appear to have an excellent defence because it has conceded only 20 goals. But if the goalkeeper has prevented six or seven extra goals, the defensive structure may be much more vulnerable than the league table suggests.
If that goalkeeper is injured or his performance regresses, the team’s goals-conceded numbers can change quickly.
Clean Sheets Are Useful, but Easy to Misread
Clean sheets are one of the most popular defensive statistics.
They are useful because they tell you how often the opponent fails to score.
But a clean sheet does not necessarily mean the goalkeeper or defence played well.
Consider two clean sheets.
Match A
- Opponent xG: 0.35
- One shot on target
- Almost no dangerous attacks
Match B
- Opponent xG: 2.1
- Six shots on target
- Three big chances
Both finish 1-0.
The clean-sheet column treats them identically.
For future predictions, they are completely different.
Match A shows a strong defensive performance.
Match B may show exceptional goalkeeping or poor opposition finishing.
This matters for BTTS and Team Over 0.5 markets. A team with many clean sheets can still be vulnerable if those clean sheets are being protected by unusually strong goalkeeping.
Shots on Target Faced Matter
A goalkeeper cannot make saves if the defence prevents shots.
This is why shots on target faced should always be included.
Suppose Team A concedes only one goal per match, but its keeper faces six shots on target on average.
Team B also concedes one per match but allows only 2.5 shots on target.
Team B’s defensive numbers are much more sustainable.
Team A is relying heavily on its goalkeeper.
This can be useful when looking for future Over or BTTS opportunities.
If a team regularly allows five or six accurate shots, the chance of its goalkeeper continuing to save everything is lower than if opponents rarely test him at all.
Look at Goals Conceded Per Shot on Target
Another simple measure is how often shots on target become goals.
Suppose a goalkeeper faces 50 shots on target and concedes 10.
That means one in five goes in.
Another faces 50 and concedes 20.
That is a major difference.
Again, shot quality matters, but over a reasonable sample this statistic can help identify teams whose defensive record is being helped or hurt by goalkeeper performance.
It becomes especially useful when combined with:
- xGA
- Shots on target faced
- Big chances conceded
- Save percentage
The best analysis looks at all four together.
High Claims and Crosses Can Affect Goal Markets
Some goalkeepers dominate crosses.
Others remain close to their line and leave defenders to deal with aerial balls.
This can matter when the opponent relies heavily on:
- Corners
- Wide free kicks
- Crosses
- Long throws
A goalkeeper who regularly claims high balls can reduce the value of an opponent’s set-piece threat.
Imagine Team A creates many corners and crosses but faces a goalkeeper who confidently collects most deliveries into the six-yard box.
The raw corner count may look attractive, but the actual scoring route is weaker.
Now imagine the same attacking team faces a goalkeeper who rarely leaves his line and a defence weak in the air.
Set-piece goal potential becomes more interesting.
Sweeper-Keeper Numbers Can Matter Against Counterattacks
Modern goalkeepers are often expected to defend space behind the defensive line.
This is particularly important for teams that press high.
A goalkeeper who is quick off his line can stop attacks before they become shots.
A slower or less decisive keeper may leave the team vulnerable to through balls and one-on-one situations.
This matters when the opponent has fast forwards.
Suppose a favourite uses an aggressive high line. Normally, its goalkeeper regularly sweeps behind the defence.
If that goalkeeper is replaced by a backup who stays deeper, the same tactical system may suddenly become more vulnerable.
This can improve the case for:
- Underdog Team Over 0.5
- BTTS – Yes
- Over 2.5
The outfield formation has not changed, but the defensive protection behind it has.
Distribution Can Affect Goals at Both Ends
Goalkeeper passing statistics may appear less relevant to goal predictions, but they can matter.
A goalkeeper who is comfortable with the ball can help a team:
- Beat the press
- Keep possession
- Start counterattacks
- Find wide players quickly
A poor distributor can create dangerous turnovers.
Suppose a team insists on building from the back, but its goalkeeper regularly misplaces passes under pressure.
Against an aggressive pressing opponent, that can become a direct route to chances.
On the other hand, a goalkeeper with accurate long distribution may bypass the press and immediately create attacking transitions.
Goalkeeper statistics are not only defensive.
They can influence how the entire match develops.
Penalty-Saving Records Need a Large Sample
Penalty records attract attention because they are easy to understand.
One keeper may have saved three penalties recently, while another rarely gets close.
However, penalty samples are usually small.
Saving two from three does not mean a goalkeeper has suddenly become a 67% penalty-saving keeper.
Still, penalty history can matter in certain situations, especially for cup ties and shoot-outs.
For normal goal predictions, it should carry much less weight than open-play save data, shot quality and overall goalkeeper performance.
Backup Goalkeepers Can Change a Prediction
A goalkeeper injury is often treated like a routine team-news update.
It can be much more important.
Before reacting, compare the first-choice and backup keeper.
Look at:
- Save percentage
- Goals prevented
- Experience
- Cross claiming
- Distribution
- Previous starts with the defence
Suppose the first-choice goalkeeper has consistently prevented goals above expectation, while the backup has very limited top-level experience.
A defence that previously looked strong may deserve a downgrade.
This can affect BTTS, Over 2.5 and opponent team totals.
But do not assume every backup is significantly worse. Some clubs have two strong keepers with very similar numbers.
Practical Example: Clean Sheets Hide Defensive Problems
Imagine a team has kept five clean sheets in eight matches.
That looks impressive.
The deeper statistics show:
- 5.4 shots on target faced per match
- 1.6 xGA
- Several big chances conceded
- Goalkeeper saving well above expectation
The defence may not be as strong as the clean sheets suggest.
The next opponent has a strong attack averaging five shots on target and 1.8 xG.
Home Team Over 0.5 or BTTS may still have a reasonable foundation despite the apparent defensive record.
The key is recognising that the goalkeeper has been doing a large amount of the work.
Practical Example: Poor Results, Better Goalkeeper Performance
Now imagine another team has conceded 12 goals in six matches.
That sounds terrible.
But the goalkeeper has faced:
- 35 shots on target
- 15 big chances
- More than 14 expected goals on target
He has actually prevented a few goals.
The problem is not necessarily the goalkeeper. The defence is allowing too many dangerous situations.
This distinction matters because replacing the keeper may not fix the issue.
For Over predictions, the defence itself remains vulnerable.
Practical Example: Backup Keeper Increases Goal Potential
Suppose the usual starting goalkeeper is unavailable.
The first-choice keeper has:
- 76% save rate
- Strong goals-prevented numbers
- Excellent command of crosses
The backup has:
- 62% save rate over a smaller sample
- Limited top-level minutes
- Less aggressive cross claiming
The opponent regularly creates high-quality shots and dangerous set pieces.
That goalkeeper change can strengthen the case for the opponent’s team total.
It should not decide the bet alone, but it can be an important adjustment.
Goalkeeper Statistics and BTTS
For BTTS, you need to assess both goalkeepers.
A strong BTTS profile may involve:
- Both teams creating good xG
- Both allowing several shots on target
- Low clean-sheet rates
- Goalkeepers performing around or below expectation
The opposite can weaken BTTS.
If both teams have excellent shot-stoppers and allow mostly low-quality chances, a 1-0 or 1-1 result may be more likely than raw shot totals suggest.
This is one area where goalkeeper statistics can improve a prediction that otherwise relies only on team-level numbers.
Goalkeeper Statistics and Over 2.5
Over 2.5 becomes more interesting when:
- Defences allow many accurate shots
- Goalkeepers have weak save percentages
- Goals conceded exceed expected goals on target
- Backup keepers are starting
- Both teams create high-quality chances
However, do not overreact to one bad goalkeeper performance.
One match with three goals conceded from four shots can happen.
Look for a pattern over a meaningful number of minutes.
Be Careful With Small Samples
Goalkeeper statistics can move quickly.
A keeper who faces 10 shots and concedes four will initially look poor.
After another 40 shots, the percentage may look completely different.
Early in the season, combine current numbers with:
- Previous-season performance
- Career history
- Quality of opponents
- Sample size
A strong or weak five-match run should not automatically override several seasons of evidence.
Goalkeeper Prediction Checklist
Before using goalkeeper data, check:
- Save percentage
- Shots on target faced
- Goals conceded
- Expected goals on target faced
- Goals prevented
- Clean sheets
- Big chances faced
- Cross claiming
- Sweeper actions
- Distribution
- First-choice or backup status
- Home and away splits
- Sample size
The goal is to understand whether the goalkeeper is improving, damaging or simply reflecting the team’s defensive performance.
Frequently Asked Questions
Is save percentage the most important goalkeeper statistic?
It is useful, but goals prevented and shot quality provide better context. A high save percentage can be inflated by easy shots.
Can a goalkeeper make a defence look better than it really is?
Yes. A strong shot-stopper can protect a team that allows too many high-quality chances.
Are clean sheets reliable for goal predictions?
They are useful but should be checked against xGA and shots on target. Some clean sheets result from excellent goalkeeping rather than strong defending.
Does a backup goalkeeper automatically mean more goals?
No. Compare the quality of the two keepers first. Some backups are very capable, while others represent a clear downgrade.
Are goalkeeper stats useful for BTTS?
Yes. They can help show whether low goals-conceded numbers are sustainable and whether both teams have a realistic route to scoring.
Final Thoughts
Goalkeeper statistics can add an important layer to football predictions because they help separate defence from shot stopping.
Save percentage tells you how often shots are stopped. Goals-prevented statistics provide context about shot difficulty. Clean sheets show outcomes, while shots on target faced reveal how much work the goalkeeper is actually doing.
The most useful question is not simply whether a goalkeeper is “good”.
Ask whether the team’s defensive record is supported by strong defending or heavily dependent on exceptional saves.
That distinction can uncover opportunities in BTTS, Over 2.5 and team-total markets.
A defence allowing very few dangerous shots is usually more trustworthy than one surviving because its goalkeeper keeps producing outstanding performances.
Use goalkeeper statistics alongside xG, shots on target and tactical analysis, and they can help explain goal patterns that the league table alone cannot show.
Responsible betting: Goalkeeper performance can change from match to match and should never be treated as a guarantee. Use several indicators together, keep stakes within a fixed budget and never bet money you cannot afford to lose.