
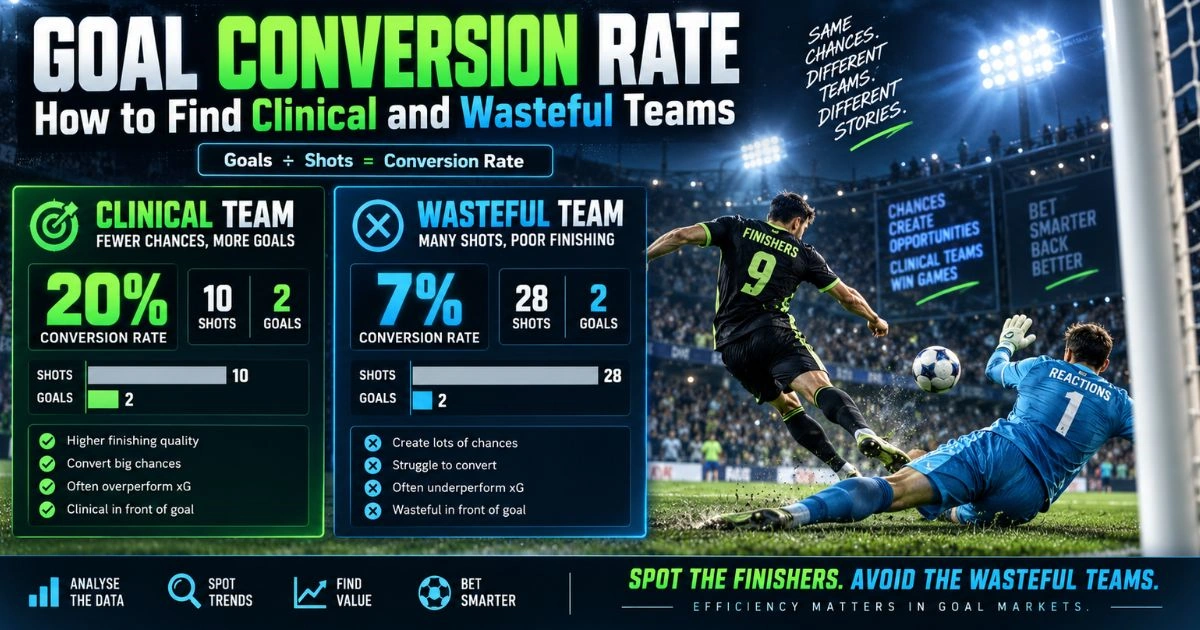
Two football teams can create the same number of shots and finish with very different scores.
One may turn 12 attempts into three goals. Another may take 18 shots and score only once.
That difference is often described through goal conversion rate.
For bettors, conversion rate can be useful because it helps explain whether a team is finishing chances efficiently or wasting too many opportunities. It can also reveal when recent scoring numbers may be difficult to sustain.
However, conversion rate is easy to misuse.
A team scoring from 25% of its shots over three matches may simply be enjoying a hot finishing streak. Another converting only 6% may be creating excellent chances but suffering from poor short-term finishing.
The key is not just finding high and low percentages. It is understanding why those percentages exist.
What Is Goal Conversion Rate?
The basic calculation is simple:
Goals ÷ Total shots × 100
For example, if a team scores 10 goals from 80 shots: 10 ÷ 80 × 100 = 12.5% conversion rate
That means roughly one in every eight attempts becomes a goal.
You can also calculate conversion using shots on target instead of total shots, although that measures something slightly different.
For example: 10 goals from 30 shots on target = 33.3% shots-on-target conversion
Both versions can be useful.
Total-shot conversion measures how efficiently all attempts become goals. Shots-on-target conversion focuses more closely on what happens once the team actually tests the goalkeeper.
What Counts as a Good Conversion Rate?
There is no universal number that works for every league.
Different competitions have different shot quality, defensive standards and playing styles.
As a practical guide, a team converting around 8–12% of total shots may be operating in a fairly normal range.
A rate above roughly 13–15% can indicate very strong finishing, although it may also be difficult to maintain.
A rate below 7–8% can suggest wastefulness, poor shot selection or simply bad short-term finishing.
These are broad benchmarks, not strict rules.
An elite team creating mostly close-range chances should convert at a higher rate than a low-quality side taking speculative efforts from outside the box.
The percentage only makes sense when you understand the chance quality behind it.
Clinical Teams Do Not Necessarily Shoot More
A common mistake is assuming the best attacking teams always produce the most shots.
Some of the most efficient attacks are selective.
Imagine two teams:
Team A
- 15 shots per match
- 1.5 goals
- 10% conversion
Team B
- 10 shots per match
- 1.8 goals
- 18% conversion
Team A produces more attempts.
Team B scores more.
Team B may be taking fewer but much better chances, or it may have superior finishers.
This is why shot volume and conversion should be viewed together.
A team with both high shot volume and strong conversion is especially dangerous.
A team with low shot volume and high conversion may be more vulnerable to regression if finishing drops.
Expected Goals Helps Explain Conversion
Expected goals is one of the best ways to add context.
Suppose Team A has:
- 20 goals
- 12 xG
- 15% conversion
Team B has:
- 15 goals
- 18 xG
- 9% conversion
Team A looks more clinical.
But it is also scoring far above the quality of chances created.
Team B is scoring less than expected despite creating more dangerous opportunities.
For future predictions, Team B may actually offer more attacking upside.
This is where the difference between finishing quality and finishing variance becomes important.
A team can outperform xG for a short period because of:
- Long-range goals
- Goalkeeper errors
- Exceptional finishing
- Penalties
- Deflections
- Small samples
If the conversion rate remains extremely high without equally strong xG, caution is sensible.
Look at xG Per Shot
One useful statistic is xG per shot.
This tells you the average quality of each attempt.
Suppose:
Team A
- 100 shots
- 10 xG
- xG per shot: 0.10
Team B
- 80 shots
- 12 xG
- xG per shot: 0.15
Team B creates fewer shots, but they are much better chances.
If Team B also has a higher conversion rate, the finishing may be more sustainable because the team is shooting from better positions.
A high conversion rate supported by strong xG per shot is usually more trustworthy than one built on difficult attempts.
Penalties Can Inflate Conversion Rate
Penalties are high-quality scoring chances.
A team receiving several penalties in a small number of matches may suddenly look extremely clinical.
Suppose a team scores 12 goals from 70 shots.
That is a 17.1% conversion rate.
But four goals came from penalties.
Its open-play finishing may be much less impressive than the headline figure suggests.
For cleaner analysis, consider:
- Non-penalty goals
- Non-penalty xG
- Open-play shots
- Set-piece goals
This is particularly important early in the season, when a few penalties can heavily influence percentages.
Clinical Does Not Always Mean Sustainable
A striker scoring seven goals from 20 shots looks extremely efficient.
That is a 35% conversion rate.
Can it continue?
Possibly, but probably not at exactly the same level unless the chances are consistently excellent.
Over larger samples, extreme conversion rates tend to move closer to more normal levels because finishing is volatile.
This is why bettors should be careful with teams that have suddenly started scoring from almost every clear sight of goal.
Recent results might show:
- 3-0
- 4-1
- 2-0
- 3-1
But if the team has produced only moderate xG, the scoring streak may be running hotter than the underlying attack.
That can make Team Over 2.5 or high goal lines less attractive at short odds.
Wasteful Teams Can Still Be Good Goal Bets
Low conversion does not automatically mean avoiding a team.
Sometimes wastefulness creates opportunities.
Imagine a home team with:
- 16 shots per match
- 6 shots on target
- 1.9 xG
- Only 1.1 actual goals
- Conversion rate of 6.9%
The attack is creating plenty. The finishing has been poor.
If it now faces a weak defence that allows many shots inside the box, its scoring output may improve even if recent results look disappointing.
This is often a better situation than backing a team scoring two goals per match from very low shot volume.
The first team has a strong process.
The second may be relying on unusually efficient finishing.
Shots on Target Conversion Adds Another Layer
Total-shot conversion can be influenced by shot selection.
Shots-on-target conversion can help show what happens after the attempt is accurate.
Consider:
Team A
- 40 shots on target
- 12 goals
- 30% conversion
Team B
- 40 shots on target
- 7 goals
- 17.5% conversion
Both test the goalkeeper equally often.
Team A has finished far more efficiently.
Before assuming Team B is simply unlucky, check:
- Shot location
- Goalkeeper quality faced
- Big chances
- xG
- Number of weak long-range efforts
A low shots-on-target conversion rate can indicate poor finishing, but it can also mean most accurate shots are easy saves.
Home and Away Conversion Can Be Very Different
Some teams finish much better at home.
Confidence, familiarity and stronger attacking performances can all matter.
A team might have:
- 14% home conversion
- 7% away conversion
Its overall rate of 10.5% hides a major venue split.
For goal betting, this matters.
If the team is playing at home, use home conversion alongside home xG and shot volume.
If it is travelling, away numbers deserve more weight.
The same applies to the opponent’s defensive record.
A team may allow opponents very low conversion at home but much higher conversion away.
Practical Example: Clinical but Potentially Overvalued
Imagine a team has scored 15 goals from 75 shots.
That is a 20% conversion rate.
The deeper numbers show:
- 9.5 xG
- 3 penalties
- Several long-range goals
- Only 4 shots on target per match
The team has clearly finished well.
But the scoring may be difficult to maintain.
If bookmakers shorten Team Over 1.5 because of the recent goal streak, the price may no longer offer much value.
The important question is whether the chance creation supports the scoring level.
Practical Example: Wasteful but Improving
Now imagine another team has scored only eight goals from 110 shots.
Its conversion rate is just 7.3%.
That looks poor.
However:
- xG is 14.2
- It averages 5.5 shots on target
- It creates several big chances
- Its main striker recently returned from injury
The attack may be underperforming rather than fundamentally weak.
Against a vulnerable defence, Team Over 0.5 or Over 1.5 could still be attractive despite the low recent conversion.
Goal Conversion and Over 2.5 Betting
Conversion rate can help explain whether a high-scoring trend is strong or fragile.
Suppose both teams have recorded Over 2.5 in seven of their last ten matches.
That looks promising.
But one side is converting 19% of its shots despite producing only moderate xG.
The other is converting 16%.
The Over trend may be partly driven by unusually efficient finishing.
Now compare another fixture where both teams convert around 10–12% but generate high shot volume and strong xG.
That second match may have a more sustainable goal profile.
For Over 2.5, you usually want both chance volume and reasonable finishing, not necessarily extreme conversion.
Goal Conversion and BTTS
BTTS analysis should focus on whether both teams can produce at least one goal.
A team with a low conversion rate may still be useful if it creates enough opportunities.
For example:
- 1.5 xG per away match
- 5 shots on target
- 9% conversion
- Scores in 8 of 10 away matches
That is still a credible BTTS profile.
By contrast, a team with a 17% conversion rate but only two shots on target per match may be much less reliable.
High efficiency cannot compensate forever for weak attacking volume.
Track Conversion Over a Larger Sample
Conversion rate is especially unstable over short periods.
A team scoring four goals from 12 shots across two matches has a 33% conversion rate.
That tells you almost nothing about its long-term finishing ability.
Whenever possible, compare:
- Last 5 matches
- Last 10 matches
- Full-season rate
- Home or away rate
If the last-five figure is dramatically different from the season average, ask why.
Has the team changed striker? Has the manager changed tactics? Are the opponents weaker? Or is this simply a finishing streak?
The answer determines whether the recent rate deserves extra weight.
Do Not Ignore Defensive Conversion
You can apply the same concept to opponents.
Suppose a defence has conceded only eight goals from 100 shots faced.
That is an 8% opponent conversion rate.
If its xGA is much higher than the goals conceded, strong goalkeeping or opponent finishing may have protected it.
Another defence may have conceded 16 from the same number of shots.
Before calling it terrible, check whether opponents have been converting at an unusually high rate.
This can help identify defences whose recent clean sheets—or lack of them—may be misleading.
Goal Conversion Checklist
Before using conversion rate in a prediction, check:
- Goals scored
- Total shots
- Shots on target
- Conversion percentage
- xG
- xG per shot
- Big chances
- Penalty contribution
- Home and away splits
- Recent rate vs season average
- Opponent quality
- Whether finishing looks sustainable
Conversion should explain the scoring record, not replace the rest of the analysis.
Frequently Asked Questions
How is goal conversion rate calculated?
Divide goals scored by total shots and multiply by 100.
What is considered a good conversion rate?
There is no fixed benchmark, but roughly 8–12% of total shots can be a normal range, while consistently higher rates may indicate strong finishing or unusually good chance quality.
Is a high conversion rate always positive?
No. If it is far above xG and based on a small sample, it may be difficult to sustain.
Can a wasteful team still be good for goal bets?
Yes. A team creating high xG, many shots and big chances may improve its scoring even if recent finishing has been poor.
Is xG better than conversion rate?
They answer different questions. Conversion measures finishing efficiency, while xG measures chance quality. They are most useful when analysed together.
Final Thoughts
Goal conversion rate helps explain why some teams score more efficiently than others.
A clinical team can turn a small number of chances into goals. A wasteful team may dominate matches without getting the return its attacking play deserves.
For bettors, the important part is deciding whether the finishing rate is repeatable.
High conversion supported by strong xG, good shot locations and proven finishers can be meaningful. Extremely high conversion from average chances may be a warning that recent scoring is unsustainable.
Likewise, a low conversion rate does not automatically mean the attack is poor. If xG, shots on target and big chances remain strong, goals may eventually follow.
The best approach is to use conversion rate as a bridge between chances and actual goals.
It tells you not only how often a team scores, but how efficiently it turns attacking opportunities into results.
Responsible betting: Conversion rates can change quickly and do not guarantee future finishing. Use them alongside broader statistics, keep stakes within a fixed budget and never bet money you cannot afford to lose.