
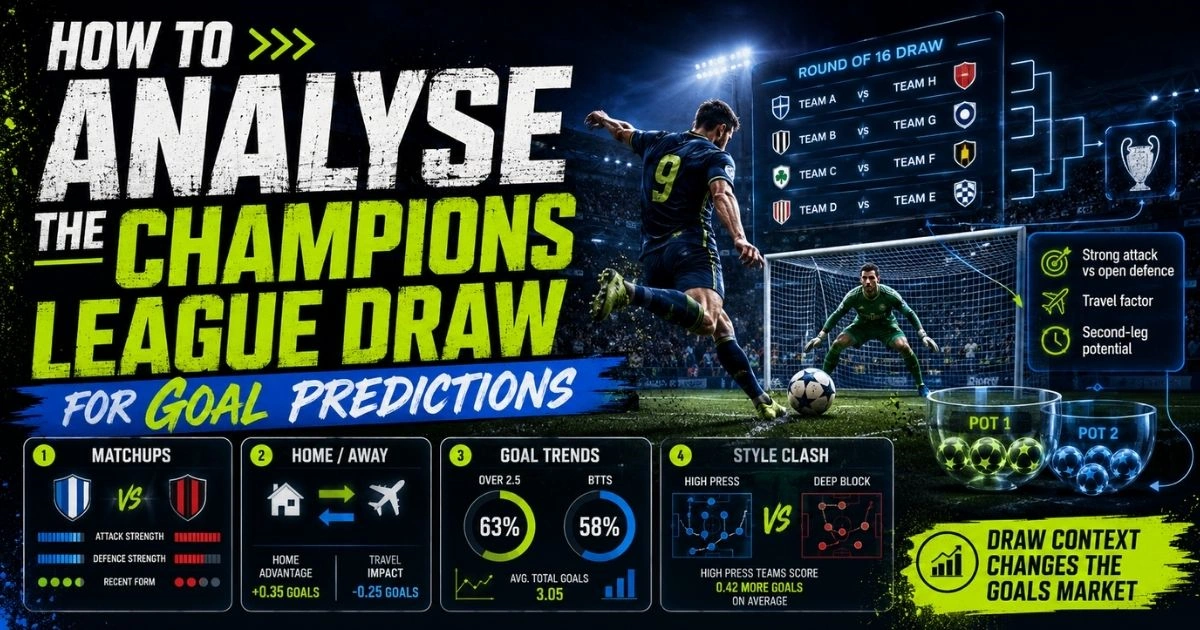
The Champions League draw creates an immediate temptation to look for winners and losers. Which club received the easiest opponents? Who has the toughest schedule? Which heavyweight clashes are coming?
For goal predictions, there is another question worth asking: What kind of matches has the draw created?
Under the current league-phase format, every club faces eight different opponents rather than playing three group rivals home and away. The 36 teams are divided into four pots, and each club receives two opponents from every pot—one at home and one away. That means even the highest-ranked teams face opponents from their own pot, while lower-ranked clubs do not spend the entire phase playing only stronger sides.
This variety makes the draw useful for identifying potential Over 2.5, BTTS, team-goal and Under opportunities long before individual match odds are released.
The trick is not to judge the draw by club names alone.
For the broader match-analysis framework, read our guide to football goal predictions, including Over/Under, BTTS, venue form, expected goals and match context.
Start With the Eight Individual Matchups
The old group-stage approach encouraged bettors to label a group as easy or difficult. That is less useful now because every team has its own set of eight opponents.
A club plays:
Two teams from Pot 1
Two from Pot 2
Two from Pot 3
Two from Pot 4
Four matches at home
Four away
The 2026/27 draw follows this exact structure.
For goal predictions, analyse each fixture separately.
A Pot 1 opponent does not automatically mean a difficult goal matchup. An elite attacking side with an aggressive defensive line could actually create an excellent Over 2.5 or BTTS fixture.
Likewise, a Pot 4 opponent is not automatically ideal for goals. A compact underdog defending with ten players behind the ball might make a dominant favourite work extremely hard for a 1-0 or 2-0 win.
Instead of asking, “How strong is the opponent?”, ask: How do these two styles interact?
That is much more useful for predicting goals.
Home and Away Placement Matters
The draw does not only determine opponents. It determines where each match is played.
That can completely change the goal expectation.
Imagine a team receives two difficult opponents:
An attacking heavyweight at home
A defensive specialist away
The first match could favour BTTS or Over 2.5 because the home side is more willing to attack and the visitor also has major offensive quality.
The second could be much tighter if the home team controls space well and the visitor becomes cautious away.
For every drawn opponent, check:
Home goals scored
Away goals scored
Home and away xG
Clean-sheet percentages
Failure-to-score rates
Over 2.5 percentages by venue
BTTS rates by venue
Overall season averages are useful, but the home-away split is usually more relevant once the draw tells you the venue.
Our guide to home and away form for goal bets explains how the home side’s venue-specific attack and defence should be compared directly with the visitor’s away profile.
Look for Style Clashes
Some Champions League pairings immediately create interesting goal scenarios because of the tactical matchup.
High press vs risky build-up
A team that presses aggressively can create goals against an opponent that insists on playing from the back. Possession losses near the penalty area can produce chances before the defence has time to organise.
High defensive line vs fast counterattack
A dominant favourite may control possession but leave space behind its defenders. Against quick forwards, that can create a credible scoring route for the underdog. This can be particularly useful for BTTS.
Possession team vs deep block
This matchup is more difficult. The favourite may dominate the ball but face very little space around the penalty area. A 65% possession figure does not guarantee three goals. Results such as 1-0 and 2-0 can become realistic, making team totals or BTTS – No potentially more suitable than Over 2.5.
Two transition teams
These fixtures can become surprisingly open because both sides are comfortable attacking space rather than controlling possession.
The draw becomes more useful when you classify opponents by style instead of only coefficient or reputation.
Identify Where the Goals Could Come From
One of the best ways to analyse a Champions League draw is to ask whether each matchup has one or two credible sources of goals.
Consider a powerful home favourite against a weaker visitor.
If the favourite regularly scores two or three goals and the visitor struggles away, the match can still support Over 2.5 even if BTTS looks weak.
Possible scores include:
3-0
4-0
3-1
Now consider two evenly matched attacking teams that both score and concede regularly.
Possible scores may include:
1-1
2-1
1-2
2-2
Here, BTTS may actually be the stronger market because 1-1 is enough.
Do not treat “goals expected” as one prediction. Decide whether the total is likely to depend on one dominant attack or contributions from both teams.
Our BTTS vs Over 2.5 comparison explains how to choose between the markets when one favourite may cover most of the total alone or both teams have a credible scoring route.
Use Champions League Scoring Levels as Context
The modern league phase has produced plenty of goals.
The inaugural 2024/25 league phase generated 470 goals in 144 matches, or 3.26 per game. In 2025/26, that increased to 487 goals and 3.38 per match.
Those figures confirm that the competition can offer a strong environment for goal markets.
But they should not become a shortcut.
An average of more than three goals does not mean every Champions League fixture should be backed Over 2.5. UEFA’s analysis of the 2024/25 league phase also found that 1-0 was the single most common scoreline, which is a good reminder that spectacular high-scoring matches coexist with controlled ones.
Use the competition average as background. Use the individual matchup to make the prediction.
Our guide on how to predict Over 2.5 goals explains which team-level statistics should confirm a high-scoring matchup before the competition’s overall goal average is given additional weight.
Compare Attacking xG With Defensive xGA
Once the draw is known, expected-goals statistics can help identify particularly interesting combinations.
Suppose Team A averages:
2.0 home xG
2.1 actual home goals
Its drawn opponent averages:
1.7 away xGA
More than five shots on target allowed away
Those numbers reinforce the idea that Team A could score several goals.
For BTTS, you would then reverse the analysis:
How much away xG does the visitor create?
How much home xGA does Team A concede?
If the visitor generates only 0.6 away xG, Over 2.5 may still work, but BTTS becomes less attractive.
For a deeper explanation of this process, our expected goals guide shows how attacking xG and defensive xGA can expose favourable or misleading scoring matchups.
This is more useful than simply comparing how many goals each club scored in its domestic league.
Consider League Strength
Domestic statistics do not transfer perfectly into the Champions League.
For wider league context, our comparison of European leagues with the most Over 2.5 goals shows how scoring environments differ before those domestic numbers are adjusted for Champions League opposition.
A club may average 2.5 goals per match because it dominates its national competition. Against stronger European opposition, it may have much less possession and produce fewer chances.
Conversely, a mid-table side from a strong league may have moderate domestic attacking numbers but become extremely dangerous against a Champions League opponent that leaves more defensive space.
When comparing drawn teams, consider:
Strength of domestic opposition
Previous European performances
Results against teams of similar quality
How the team performs without dominating possession
This is especially important with champions from smaller leagues. Their domestic numbers may be excellent without necessarily predicting European scoring output.
Look at the Order of Fixtures
The opponent list tells you who will play. The fixture schedule adds another layer.
The league phase contains eight matchdays, and all 36 teams are ranked together. The top eight qualify directly for the round of 16, positions 9–24 enter the knockout play-offs and teams finishing 25–36 are eliminated.
For a complete explanation of how that structure changes qualification pressure, motivation and betting decisions, read our Champions League league phase guide.
Once the competition moves into two-leg knockout football, the aggregate score becomes a separate part of the analysis. Our Champions League play-off second-leg guide explains how qualification scenarios change Over, Under, BTTS and late-goal markets.
That creates changing motivation.
Early matches may be played with patience because there is plenty of time to recover points.
For the opening round specifically, our Champions League Matchday 1 goal-markets guide explains how to adjust domestic form, league strength, new signings and early-season uncertainty before choosing Over/Under or BTTS markets.
By Matchdays 7 and 8, a team may urgently need:
A win to enter the top eight
Points to stay inside the top 24
A stronger goal difference
A victory to avoid elimination
When the table creates genuine urgency, our guide to must-win matches explains why needing a result can increase attacking risk without automatically guaranteeing more goals.
The final league-phase matchday can therefore have a completely different goal profile from Matchday 1.
The inaugural league phase demonstrated this clearly: Matchday 8 produced 64 goals across 18 simultaneous fixtures, an average of 3.55 per game, with qualification and ranking still at stake across the table.
Watch for Travel and Scheduling
An away fixture is not equally difficult in every case.
Consider:
Travel distance
Domestic fixture immediately before the match
Domestic fixture immediately afterwards
Climate
Artificial surfaces
Recovery time
Squad depth
A long European journey between two difficult league games can influence rotation and intensity.
Our guide to goal predictions after European matches explains how recovery time, travel, rotation and squad depth can affect attacking and defensive performance around congested schedules.
This does not automatically mean fewer goals. A rotated defence can actually increase goal potential.
The important question is which part of the team is likely to be affected.
Practical Draw Example
Imagine a strong attacking team receives these fictional fixtures:
At home
Elite possession team
Aggressive pressing team
Mid-level counterattacking side
Defensive outsider
Away
Elite transition team
Strong defensive club
Open attacking team
Inexperienced qualifier
You should not classify all eight as equally attractive for goals.
The home match against the elite possession team may support BTTS because both sides can create.
The defensive outsider could be more suitable for the favourite’s team total or BTTS – No.
The away match against the open attacking team may provide the best Over 2.5 opportunity.
The strong defensive away opponent could be an Under candidate.
One draw can therefore generate four completely different betting profiles.
A Champions League Draw Checklist
Once the draw is complete, review each fixture for:
Home or away venue
Goals scored and conceded
Over 2.5 and BTTS percentages
xG and xGA
Clean sheets
Failure-to-score rates
Tactical matchup
Domestic league strength
European experience
Travel demands
Fixture timing
Likely motivation at that stage
The draw provides the framework. The statistics tell you which fixtures deserve closer attention.
Frequently Asked Questions
Does a favourable Champions League draw mean more goals?
Not necessarily. A strong favourite may face several defensive opponents. The quality gap matters less than how the teams’ styles interact.
Are Pot 1 matches automatically good for BTTS?
No. Some elite teams combine strong attacks with excellent defences. Check each side’s scoring route rather than relying on seeding.
Should domestic goal statistics be used?
Yes, but adjust them for league strength and European opposition. Home-away splits and xG can provide additional context.
Are later league-phase matches better for goal betting?
They can become more open when teams urgently need points or goal difference, but the table situation should be checked before each match.
Is Over 2.5 better than BTTS in Champions League mismatches?
Often it can be. A dominant favourite may cover the three-goal requirement alone while the underdog fails to score.
Final Thoughts
Analysing the Champions League draw for goal predictions is about much more than identifying the strongest and weakest teams.
The current format gives every club eight different opponents and a mixture of home and away challenges. That creates a wide range of tactical matchups—and those matchups are where the useful goal clues appear.
Start with the venue and team styles. Then compare scoring rates, xG, defensive numbers and the likely source of the goals. Finally, account for schedule position and what each team may need from that particular matchday.
A glamorous fixture is not automatically a good goal bet, and an apparent mismatch is not automatically Over 2.5.
The most useful draw is the one that creates a match pattern you can actually explain.
Responsible betting: Use the draw and statistics as analytical tools rather than guarantees, keep stakes within a fixed budget and never bet money you cannot afford to lose.