A football prediction can lose even when the analysis was good.
Over 2.5 Goals might produce several big chances but finish 1-1. A BTTS selection can fail because a striker misses an open goal. A strong favourite can dominate the match and concede from one late counterattack.
That makes individual results a poor way to judge prediction quality.
This is where Closing Line Value, usually shortened to CLV, becomes useful.
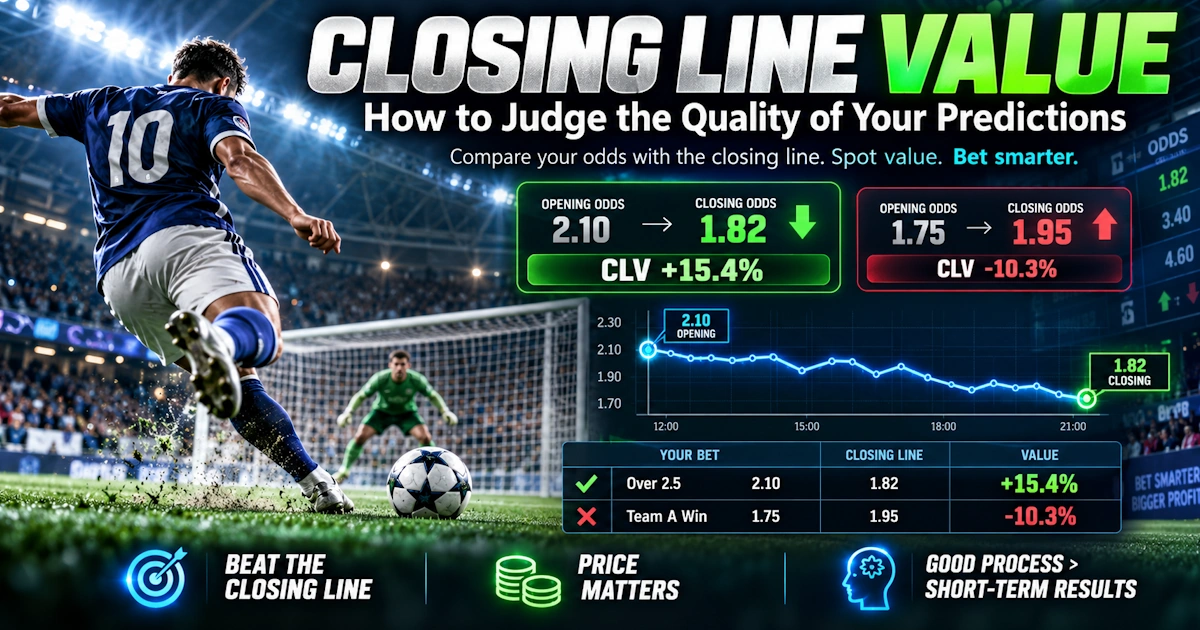
CLV compares the odds you took with the market price available shortly before kick-off.
If you regularly take higher odds than the closing price on the same selection, it can be a positive sign. It suggests you identified a price before the broader market moved in the same direction.
For example:
- You bet Over 2.5 at 2.05.
- It closes at 1.80.
The match might still finish 0-0.
Your bet loses, but you obtained a substantially better price than bettors entering near kick-off.
CLV does not prove that every prediction was correct. But across a large sample, it can help you judge whether your process is finding good prices rather than simply enjoying lucky results.
What Is the Closing Line?
The closing line is the market price available close to the start of the match.
Suppose Over 2.5 Goals moves like this:
- Monday: 2.10
- Wednesday: 2.02
- Friday: 1.92
- One hour before kick-off: 1.84
- Closing price: 1.82
If you backed Over at 2.10, you obtained a much better price than the market eventually offered.
That is positive CLV.
If you waited and backed it at 1.75 before it closed at 1.82, you received a worse price.
That is negative CLV.
The idea is simple: For the same selection, higher decimal odds are better.
Why the Closing Market Is Useful
By kick-off, a football market has usually absorbed much more information than it had when prices first opened.
That may include:
- Injuries
- Suspensions
- Confirmed line-ups
- Weather information
- Tactical expectations
- Heavy betting activity
- Updated statistical models
Large and liquid football markets contain opinions from bookmakers, traders, models and many bettors.
This does not make the closing price perfect.
Markets can still be wrong.
But it provides a useful benchmark against which to compare your own price.
Simple CLV Example
Suppose you bet: BTTS – Yes at 2.00
It closes at: 1.80
Your original odds imply a raw probability of: 1 ÷ 2.00 = 50%
The closing price implies: 1 ÷ 1.80 = 55.6%
The market has moved significantly towards BTTS.
Your 2.00 ticket is much better than the 1.80 price available later.
Now imagine the match finishes 1-0.
You lost.
But should you immediately conclude the prediction was poor?
Not necessarily.
The market itself eventually became more confident in your selection.
That information is useful when reviewing the decision.
The Opposite Example
Suppose you back Over 2.5 at: 1.75
The market eventually closes at: 2.05
Your price implied: 57.1%
The closing price implies: 48.8%
The market moved strongly against your selection.
The match could still finish 4-2 and your bet could win.
But the winning result does not automatically mean your original price was good.
This is one of the most important lessons in prediction review: A good result and a good decision are not necessarily the same thing.
How to Calculate CLV Simply
One practical method is to compare your odds with the closing odds.
A simple odds-based calculation is: CLV = Your Odds ÷ Closing Odds – 1
Suppose: Your odds = 2.00 Closing odds = 1.80
2.00 ÷ 1.80 – 1 = 0.111 or approximately: +11.1%
This means your payout price was about 11.1% better than the closing price.
Another example: Your odds = 1.80 Closing odds = 1.90
1.80 ÷ 1.90 – 1 ≈ -5.3%
That is negative CLV.
This calculation is useful for tracking prices, although it should not be confused with a guaranteed expected-profit percentage.
Implied Probability Can Make CLV Easier to Understand
You can also compare probabilities.
Suppose you took: Over 2.5 at 2.10
Implied probability: 1 ÷ 2.10 = 47.6%
Closing odds: 1.80
Implied probability: 1 ÷ 1.80 = 55.6%
That is a major shift.
The market moved from pricing Over around 48% to pricing it above 55%, before bookmaker margin is removed.
If your analysis identified the Over before that movement, your timing was strong.
Remember the Bookmaker Margin
Raw implied probability includes bookmaker margin.
For a more accurate comparison, ideally you should remove the margin from both sides of the market.
Imagine the closing market is:
- Over 2.5: 1.80
- Under 2.5: 2.05
Raw probabilities:
- Over = 55.6%
- Under = 48.8% Total: 104.4%
After normalising the two sides, the approximate margin-free probability becomes:
- Over ≈ 53.2%
- Under ≈ 46.8%
This provides a cleaner estimate of the market’s underlying expectation.
For everyday record-keeping, comparing your odds with closing odds is still useful. For more detailed analysis, margin-adjusted probabilities are better.
Positive CLV Can Matter Even When Bets Lose
Imagine five Over 2.5 selections:
- Odds Taken: 2.00 | Closing Odds: 1.82 | Result: Lost
- Odds Taken: 1.95 | Closing Odds: 1.78 | Result: Lost
- Odds Taken: 2.05 | Closing Odds: 1.85 | Result: Won
- Odds Taken: 1.90 | Closing Odds: 1.75 | Result: Lost
- Odds Taken: 2.10 | Closing Odds: 1.88 | Result: Won
Only two of five bets won.
The immediate results look poor.
But every selection closed at a shorter price than you took.
That suggests something different from simply making five bad predictions.
It may mean you were consistently identifying prices before the market adjusted.
Five bets are far too few to draw strong conclusions, but over 100, 300 or 500 selections, consistent positive CLV becomes much more interesting.
Negative CLV Can Hide Behind Winning Results
Now imagine another bettor wins seven of ten bets.
Excellent month.
But most selections were taken at prices worse than the closing market.
For example:
- Took 1.70 → closed 1.85
- Took 1.75 → closed 1.95
- Took 1.60 → closed 1.80
The results are positive.
The pricing process may not be.
That bettor may simply be experiencing short-term positive variance.
This is why CLV provides information that profit alone cannot.
Practical Example: Over 2.5 Goals
You analyse a match and believe Over 2.5 should be around: 1.75
The bookmaker offers: 2.00
You place the selection.
Later, a starting defender is ruled out and the market moves: 2.00 → 1.90 → 1.82 → closing 1.78.
You obtained a strong price.
Now imagine the match finishes 1-1 despite:
- 3.0 combined xG
- 10 shots on target
- Several big chances
The prediction lost.
But both the market movement and underlying match data suggest the decision may have been reasonable.
That is exactly the type of losing selection you should distinguish from a poor bet.
Practical Example: Lucky Winner With Negative CLV
Suppose you back BTTS – Yes at: 1.65
It later drifts to: 1.95
The match produces little attacking football.
After 80 minutes it is 1-0 with only three shots on target.
Then a defender makes a mistake and the visitors score.
BTTS wins.
You made money.
But:
- The market moved against you
- The match statistics were weak
- The winning goal came from an unusual error
That is a bet worth reviewing despite the positive result.
A lucky winner should not automatically strengthen your confidence in the method.
CLV Is Especially Useful for Goal Markets
Goal markets can move significantly because new information directly affects expected scoring.
Examples include:
- A goalkeeper is ruled out: Opponent team totals or full-match Overs may shorten.
- Main striker starts: Team Over and BTTS prices may move towards goals.
- Two attackers are rested: Over may drift while Under shortens.
- Defensive midfielder is unavailable: The market may increase the expected goals of the opposition.
Tracking these movements can show whether your early analysis anticipated information or market opinion that later became reflected in the price.
Different Markets Need Separate Tracking
Do not combine everything into one CLV figure if you bet several different markets.
Track separately:
- Over 2.5
- Under 2.5
- BTTS
- Team totals
- First-half goals
- Second-half goals
You may discover that you regularly beat the closing price in Over 2.5 but not in first-half markets.
That is valuable information.
Perhaps your full-match analysis is strong while your early-goal predictions rely too heavily on small samples.
CLV can help identify your strongest area.
Closing Line Value Does Not Guarantee Profit
This needs to be clear.
Positive CLV is not a guarantee.
You can beat the closing line and still lose bets.
You can also occasionally win while consistently taking worse prices.
Football contains variance.
The value of CLV appears when it is measured over a large sample.
If you consistently obtain 2.00 on selections that later close around 1.85, that is more encouraging than judging yourself after three matches.
The longer the sample, the more useful the pattern becomes.
What If the Closing Market Is Wrong?
It certainly can be.
Markets are not perfect forecasting machines.
A closing price can overreact to:
- Popular teams
- Breaking news
- Heavy one-sided betting
- Incorrect assumptions
That is why CLV should not replace your own analysis.
Think of it as one measurement tool.
Your full review can include:
- Profit
- ROI
- Strike rate
- Average odds
- CLV
- xG after the match
- Shots on target
- Quality of your reasoning
No single metric tells the entire story.
Early Odds vs Late Odds
Some bettors prefer entering early because prices may contain more inefficiencies.
Others wait for line-ups because they want more information.
Both approaches have trade-offs.
Betting early
- Advantages: Potentially better prices, more opportunity to beat market movement.
- Disadvantages: Less team information, greater risk of injuries or rotation changing the match.
Betting late
- Advantages: Confirmed line-ups, more complete information.
- Disadvantages: Good prices may already be gone.
Tracking CLV helps you learn whether your own timing is effective.
Build CLV Into Your Monthly Review
A useful monthly review record could contain:
- Date
- Match
- Market
- Odds taken
- Closing odds
- CLV
- Result
- Profit/loss
- Notes
At the end of each month, check:
- Average CLV
- Percentage of bets beating the closing price
- CLV by market
- CLV by league
- Results vs CLV
You may find that your profitable bets have poor CLV.
Or your losing month may contain consistently strong prices.
Both findings are useful.
Do Not Obsess Over Tiny Movements
Suppose you take 1.90 and it closes 1.88.
That movement is tiny.
It may simply be market noise.
Now compare: 2.10 → 1.75
That is much more significant.
Football probability estimates are uncertain, so small price changes should not be overinterpreted.
Look for meaningful and repeated patterns across many predictions.
A Simple CLV Review Checklist
When reviewing a prediction, ask:
- What odds did I take?
- What were the closing odds?
- Did I beat the closing price?
- How large was the difference?
- Was the movement caused by new information?
- Did related goal markets move too?
- Did my reasoning remain valid after line-ups?
- Did the match create chances as expected?
- Am I consistently beating the closing line over many bets?
- Which markets produce my best CLV?
This gives you a much stronger review process than simply counting winners and losers.
Frequently Asked Questions
What is Closing Line Value?
CLV measures how the odds you took compare with the market price close to kick-off.
Is positive CLV good?
Generally, obtaining higher odds than the closing price is considered positive CLV because you secured a better price.
Can a losing bet have positive CLV?
Absolutely. A bet can lose even though you obtained significantly better odds than the closing market.
Can a winning bet have negative CLV?
Yes. Winning one bet does not prove the original price was good.
Should CLV replace profit and ROI?
No. It should be used alongside profit, ROI, strike rate and analysis quality, especially over large samples.
Final Thoughts
Closing Line Value gives you a way to evaluate predictions without allowing the final score to dominate everything.
If you bet Over 2.5 at 2.05 and the market closes at 1.80, you obtained a better price than later bettors.
The match can still finish 1-0.
That does not change the price you secured.
Likewise, a bet can win despite the market moving heavily against your original selection.
Over time, this distinction becomes extremely important.
Instead of asking only: “Did this prediction win?”
start asking: “Did I consistently get a better price than the market eventually offered?”
Profit remains important. But football contains enough short-term variance that results alone can sometimes hide whether your prediction process is improving.
CLV gives you another way to measure that process.
Responsible betting: Positive CLV does not eliminate losing runs or guarantee long-term profit. Track results over a large sample, use controlled stakes and never bet money you cannot afford to lose.