
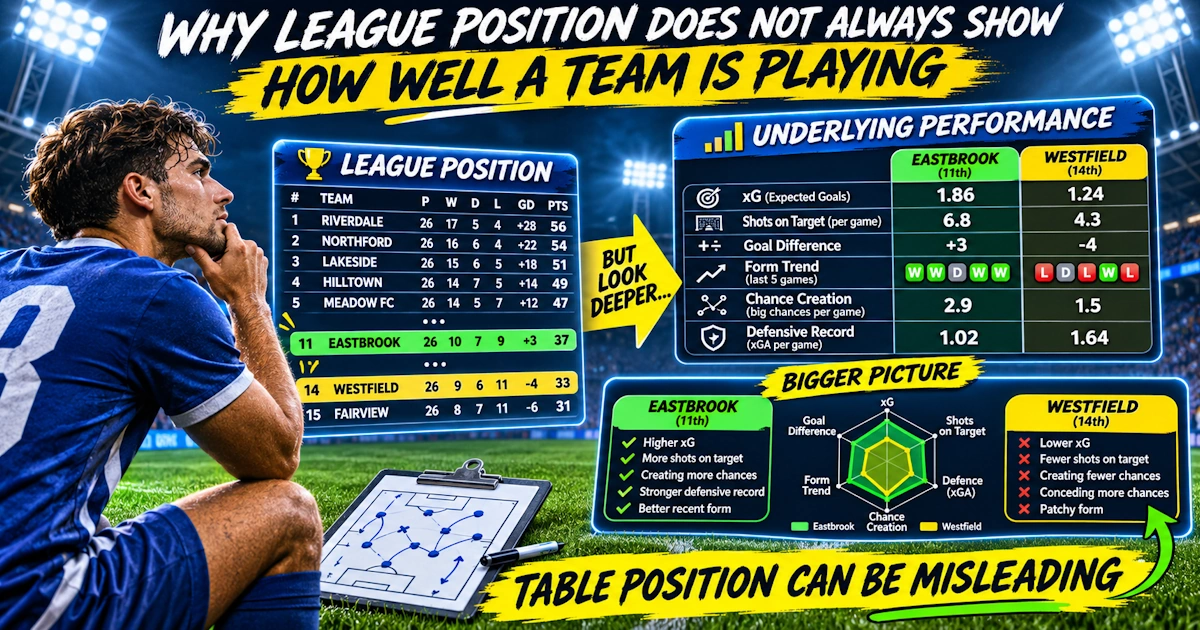
The league table is the simplest way to judge a football team. First place looks excellent. Fifth looks good. Eighteenth looks terrible. And ultimately, of course, the table decides championships, European qualification and relegation.
But there is an important difference between where a team is in the table and how well that team is actually playing.
A club can win several matches despite regularly being outplayed. Another can sit near the bottom after creating better chances than its opponents but suffering from poor finishing, goalkeeper errors or an unusually difficult fixture list. That matters for football predictions.
The league table tells you what has already happened. It does not always tell you what is most likely to happen next. To understand that, you need to look underneath the points.
The Table Measures Results, Not Performance
Football’s scoring system is simple. A team receives 3 points for a win, 1 point for a draw, and 0 points for a defeat. It does not matter whether the victory was dominant or fortunate.
Consider two matches:
Team A wins 1-0 (Shots: 6-18, xG: 0.7-2.1)
Team B loses 0-1 (Shots: 17-7, xG: 2.0-0.8)
The league table gives Team A three points and Team B zero. That is correct. But if you are trying to predict their next matches, you should probably want to know more. Team A won; Team B may have played better. This distinction between result and performance is one of the most important ideas in football analysis.
Football Contains More Short-Term Variance Than the Table Shows
Football is a relatively low-scoring sport. That makes individual moments extremely powerful. A team can dominate for 90 minutes, miss several chances and lose because the opponent scores from one deflection. Another can be outplayed but win because its goalkeeper saves six shots. Those results remain permanently in the league table.
Research published in the Journal of Sports Economics in 2025 examined expected goals and expected points across the top seven European men’s leagues over three seasons. The researchers estimated that roughly 60% of the variation in teams’ over- or underperformance relative to expected performance was attributable to luck, with around 40% attributed to skill not captured by the model. Their simulations suggested luck shifted a team’s league ranking by an average of about 1.8 positions.
That does not mean football is “60% luck”. It means that when teams finish above or below what their chance creation suggests, random variation can explain a substantial part of the gap.
Expected Points Can Tell a Different Story
Expected points (xPTS) attempt to estimate how many points a team might have earned based on the chances created and conceded. One Opta approach takes the xG values of every shot in a match and simulates the fixture 10,000 times. The proportions of simulated wins, draws and defeats are then converted into expected points.
Imagine a team has 21 actual points but 15 expected points. That does not mean it should have exactly 15 points. But the six-point difference deserves attention.
Now imagine another team has 11 actual points but 17 expected points. The league table separates the teams by ten points. Their underlying performances may be much closer. For future predictions, that can be extremely useful.
Expected Points Are Not a “Corrected” League Table
There is an important warning here. Expected points are not the true league table. Real points decide everything; xPTS is simply another analytical tool.
Models cannot perfectly measure game state, tactical intention, possession that never produces a shot, player finishing skill, goalkeeper quality, or every defensive action. Opta itself notes that expected-points models do not capture all these elements.
So do not say: “This team deserves to be sixth because xPTS says so.” A better interpretation is: “The team’s performances may be stronger than its current position suggests.” That distinction matters.
Expected Goals Can Reveal an Unlucky Team
Suppose a club has scored 8 goals from 14.5 Expected Goals (xG). Its league position may look poor because those missed chances cost points. But the attack is still generating opportunities. If the same players continue producing good chances, future scoring may improve.
Now consider a team with 17 goals from 10.5 xG. Its attack looks brilliant in the league table. But the underlying chance creation is much less impressive. That does not mean the team must suddenly stop scoring—some players genuinely possess above-average finishing ability—but you should investigate expected goals vs actual goals to see if the rate is sustainable. Opta warns against assuming that xG overperformance automatically has to be “paid back”; future chances can simply return towards normal conversion without reversing goals already scored.
Goalkeeping Can Distort League Position Too
The same effect happens at the other end. Suppose Team A allows 16 xGA but concedes only 8 goals. That could reflect excellent goalkeeping, poor opposition finishing, or a combination of both.
If the goalkeeper is genuinely elite, some defensive overperformance may persist. But if opponents repeatedly create excellent chances, you should be careful about calling the defence strong simply because few goals have gone in.
Now imagine Team B has conceded 18 goals from 11 xGA. Its league position may look terrible. But if several goals came from goalkeeper mistakes or extraordinary finishing, the defence may not be as bad as the results suggest.
Practical Example: The “Good” Team That Is Quietly Declining
Imagine Team A sits fourth. Recent results: W-W-W-D-W. Excellent form. But its last five matches show:
xG created: 5.8
xG conceded: 8.4
It has therefore been creating fewer chances than its opponents. The team has benefited from clinical finishing, excellent goalkeeping, and several one-goal victories. The league position says top-four team. The performance data says investigate further. If the market begins pricing Team A as an elite side because of the table, it may become overrated.
Practical Example: The Bottom-Half Team Playing Better Than Its Position
Now imagine Team B sits 15th. Recent record: L-D-L-W-L. Poor. But over those five matches:
xG created: 8.1
xG conceded: 5.9
Shots on target are also positive. The team has simply finished badly. The next opponent sits seventh, so casual analysis favours the seventh-placed club. But Team B may be much more competitive than the table suggests. This is exactly why league position should be a starting point rather than the final answer.
Strength of Schedule Can Distort the Table
Not every team faces the same level of opposition at the same time. After five matches, one club might have played the 1st, 2nd, 4th, 6th, and 8th placed teams. Another may have faced the 14th, 16th, 18th, 19th, and 20th. Their points totals are not directly comparable.
Opta analysed the opening five matchdays of the 2026/27 Premier League and found that the ten clubs judged to have the easier schedules averaged 8.2 points, while the ten with the more difficult schedules averaged only 5.2. That is a substantial difference, highlighting the importance of strength of schedule. It shows why an early league table can exaggerate differences between teams that have faced very different opposition.
Early-Season Tables Are Especially Dangerous
After five matches, one win represents 20% of the sample. A single strange result can move a club several positions. Imagine a team wins four of its first five games. That is 80% wins. It then goes 4-2-3 over its next nine. Now the original start looks much less extraordinary.
This is exactly why the league table can be misleading early in the season. Early-season predictions should rely more heavily on underlying performance, previous-season strength, squad quality, and fixture difficulty, and less heavily on raw league position.
One-Goal Matches Can Create Large Table Differences
Consider two teams. Team A wins five matches 1-0. Team B draws three and loses two matches 0-1.
The point difference is huge. But very small moments may separate them: a penalty saved, a shot hitting the post, a late deflection, or a goalkeeper mistake. Close matches naturally contain more uncertainty. If a team repeatedly wins by one goal while producing almost identical xG to its opponents, investigate whether the results are being driven by sustainable quality or favourable short-term variation.
Winning Close Games Can Still Be a Skill
Do not go too far in the other direction. Not every overperforming team is lucky. Strong teams can outperform basic models because they have elite finishers, outstanding goalkeepers, better decision-making, strong substitutes, and the tactical ability to protect leads.
The 2025 study on expected performance is useful here because it did not attribute all overperformance to luck. It estimated a meaningful portion was associated with persistent team skill not captured by expected-performance models. So when a team repeatedly exceeds xG or xPTS, ask: Why? Do not immediately assume regression.
Red Cards Can Make the Table Look Better or Worse
Suppose a team wins 4-0 but played against ten men from the 15th minute. That victory gives exactly the same three points as a 4-0 win against 11 players. But for evaluating future performance, those matches are not equivalent.
The same applies to defeats. A team may lose badly after receiving an early red card. Its league position suffers, but the match provides limited evidence about how the normal XI performs at 11 versus 11. Context matters.
Penalties Can Distort Small Samples
Imagine a team scores five penalties in its opening ten matches. Those goals are real. The points are real. But penalties may not continue arriving at the same frequency.
If the team has modest open-play xG, its league position may be benefiting from a relatively unusual source of goals. Again, the correct response is not “The team is lucky.” It is: “How repeatable is the process that produced these results?”
Home and Away Fixtures Can Create False Impressions
Suppose Team A sits sixth after ten matches but has already played six times at home. Team B sits tenth but has played six away matches.
The fixture balance matters. If home advantage is meaningful in that league, Team A may have enjoyed the easier schedule structure. Later in the season, the imbalance reverses. When evaluating home and away form, check the number and quality of home and away opponents. The table does not show any of this automatically.
Injuries Can Make Old Table Position Less Relevant
Suppose a team is third after 15 matches. Then it loses its main striker, a creative midfielder, and its first-choice centre-back.
The third-place position describes what the previous squad achieved. It may not describe the team available today. The opposite can happen too. A club sitting 14th may finally recover several key players. Its historical league position reflects months played with a weaker lineup. Football predictions should focus on the team that will actually take the field.
Manager Changes Can Break the Connection With the Table
Imagine a team sits 17th. A new coach arrives. Over the next five matches, its underlying numbers improve dramatically (from -0.8 xG difference per match to +0.4).
The league table moves slowly because the poor earlier results remain included. The team’s current quality may have changed much faster than its position. This is another reason why recent performance and tactical context can sometimes be more useful than the full-season ranking.
Rolling Data Can Detect Changes Earlier
Suppose a team remains eighth for several weeks. Its five-match rolling xG difference moves: -0.3 → -0.1 → +0.2 → +0.5 → +0.7.
The league position barely changes. The underlying performance does. A bettor watching only the table may notice the improvement several matches later. Using rolling averages can identify the trend sooner. This is particularly useful when combined with strength of schedule. Improving numbers against increasingly difficult opposition are much more convincing than improvement created by a run against weak teams.
Look at xG Difference, Not Just xG
A team creating 1.8 xG per game sounds strong. But what if it concedes 2.0 xGA? Another creates only 1.5 xG but allows 0.9 xGA. The second team has the stronger underlying balance.
A useful statistic is xG difference (xG – xGA). For example: 1.8 – 2.0 = -0.2 versus 1.5 – 0.9 = +0.6. This gives a better picture of overall team performance than attacking numbers alone.
Shots on Target and Big Chances Can Confirm the Picture
Do not rely entirely on one model. Suppose a struggling team has positive xG numbers. Check whether it also produces more shots on target, creates more big chances, and allows fewer dangerous chances.
If several indicators tell the same story, your confidence can increase. If xG says the team is excellent while every other metric looks weak using a database like soccerprediction.io, investigate further. Good football analysis combines evidence rather than searching for one magic statistic.
Market Prices Often Matter More Than Table Positions
Imagine:
Team A – 5th (Odds: 1.55, Implied Probability: 64.5%)
Team B – 13th
The temptation is to back Team A. But suppose your deeper analysis shows Team A has been overperforming xPTS and has important injuries, while Team B has a positive xG difference and faced the harder schedule. Perhaps you estimate Team A’s true win probability closer to 55%. The issue is no longer “Which team is higher?” It is “Does the price accurately reflect the difference between them?”
What Should You Check Alongside League Position?
When a table position looks surprisingly high or low, examine:
Actual points vs Expected points
Goals vs xG and Goals conceded vs xGA
xG difference, Shots on target, and Big chances
Strength of schedule and Home-away balance
Red cards, Penalties, Injuries, and Manager changes
Recent rolling performance
Quality of finishing and goalkeeping
Frequently Asked Questions
Can a team be playing well despite sitting near the bottom? Yes. A team may create good chances and restrict opponents but suffer from poor finishing, goalkeeping errors, difficult fixtures or short-term variance. xG and expected points can help reveal this.
Are expected points better than actual points? Not in the sense of deciding who deserves to win the league. Actual points determine the competition. Expected points are useful because they provide another view of the performances that produced those results.
Why is league position especially misleading early in the season? The sample is small and fixture difficulty can vary significantly. In one analysis of the opening five 2026/27 Premier League matches, teams with easier schedules averaged 8.2 points compared with 5.2 for those facing the harder schedules.
Does xG always predict future improvement? No. xG measures chance quality, not every aspect of football. Finishing skill, goalkeeping, tactics and other factors can allow some teams to overperform or underperform expected numbers for meaningful periods.
What is the best alternative to league position? There is no single replacement. A combination of xG difference, expected points, shots on target, big chances, schedule strength and current team news provides a more complete picture.
Final Thoughts
The league table is never meaningless. It tells you exactly which teams have collected the most points. What it does not always tell you is how those points were produced.
A fourth-placed team may be repeatedly winning close matches despite being out-created. A 15th-placed team may be generating strong chances but finishing badly. One team may have faced the weakest schedule in the league. Another may have already played most of the title contenders.
Research supports the idea that this gap matters. A 2025 study across seven leading European leagues found substantial variation between actual and expected performance, with simulations suggesting random variation can shift league positions even across a full season.
So do not ignore the table. Read behind it. Ask: How many chances is the team creating? Are actual goals supported by xG? Has the schedule been unusually easy or difficult?
The league table describes the past perfectly: these are the points teams earned. Football prediction requires a different question: Does that position accurately represent how strong the team is likely to be in its next match? Sometimes the answer is yes. And sometimes that difference between position and performance is exactly where the most useful football analysis begins.
Responsible betting: League position, xG and expected points are analytical tools, not guarantees of future results. Combine underlying statistics with opponent strength, current team news and available odds, keep stakes controlled and never bet money you cannot afford to lose.