The Poisson model sounds more complicated than it really is.
At its core, it tries to answer a simple football question:
If we expect a team to score a certain number of goals on average, how likely is it to score 0, 1, 2, 3 or more in a particular match?
That makes the model useful for several football markets, including:
- Correct Score
- Over/Under goals
- Both Teams to Score
- Team totals
- Match result probabilities
The model is not a magic prediction machine. Football is too messy for that. Red cards, injuries, tactical changes and game state can all break the assumptions.
But as a structured starting point, Poisson is one of the clearest ways to turn expected scoring rates into actual probabilities.
What Is the Poisson Distribution?
The Poisson distribution is a mathematical model used for counting how many times an event might occur within a fixed period.
In football, the event is usually: a goal
If you estimate that a team is expected to score 1.8 goals in a match, Poisson can estimate the probability that it actually scores:
- 0 goals
- 1 goal
- 2 goals
- 3 goals
- 4 goals
- and so on.
The expected number of goals is usually represented by the Greek letter: λ — lambda
So if the home team’s expected-goals figure for the match is 1.8: λ = 1.8
The Poisson Formula
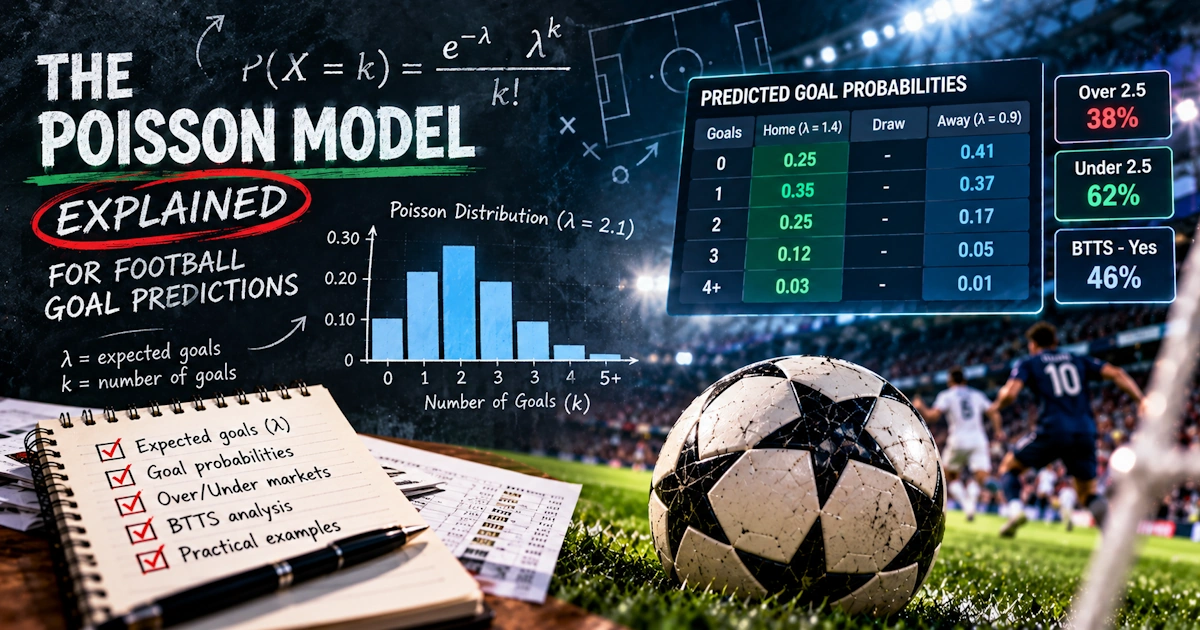
The formula is: P(X = k) = (e^-λ × λ^k) ÷ k!
Do not let that put you off.
You do not need to calculate it manually every time.
The important parts are:
- λ = expected goals
- k = number of goals you want to calculate
- P = probability of that exact number
If the home team has λ = 1.8, the model can calculate the probability of exactly two goals, exactly three goals and so on.
The useful part for bettors is what happens after those probabilities are combined.
Where Does the Expected-Goals Number Come From?
This is the most important part of the entire model.
The maths is easy.
Estimating λ properly is difficult.
You might build the expected scoring rate from:
- Home goals scored
- Away goals conceded
- xG and xGA
- League averages
- Home advantage
- Opponent strength
- Team news
- Recent tactical changes
A simple model might average the home team’s attacking output with the away team’s defensive record (using databases like Soccerway to track raw averages).
A more advanced model might calculate separate attack and defence strength ratings relative to the league average.
The better your input, the more useful the output.
Poisson cannot rescue a bad expected-goals estimate.
A Simple Practical Example
Suppose you expect:
- Home team: 1.8 goals
- Away team: 1.1 goals
So:
- Home λ = 1.8
- Away λ = 1.1
Using the Poisson formula, the home team’s approximate goal probabilities are:
Home Goals / Probability
- 0 goals: 16.5%
- 1 goal: 29.8%
- 2 goals: 26.8%
- 3 goals: 16.1%
- 4 goals: 7.2%
For the away team:
Away Goals / Probability
- 0 goals: 33.3%
- 1 goal: 36.6%
- 2 goals: 20.1%
- 3 goals: 7.4%
- 4 goals: 2.0%
Already, the model gives us useful information.
The most likely individual home total is one goal.
The most likely away total is also one goal.
But the model becomes much more useful when the two distributions are combined.
Creating Correct Score Probabilities
To estimate a score such as 2-1, multiply: Probability home scores 2 × Probability away scores 1
From the example: Home scores 2: about 26.8% Away scores 1: about 36.6%
So: 0.268 × 0.366 ≈ 9.8%
That means the model gives roughly a 9.8% probability to 2-1.
You can repeat the process for:
- 1-0
- 1-1
- 2-0
- 2-2
- 3-1
This creates a complete correct-score matrix.
That score matrix can then be used to calculate almost every common goal market.
Using Poisson for Over 2.5 Goals
Over 2.5 means the match needs at least three goals.
Using the same expected scoring rates: Home λ = 1.8 Away λ = 1.1
Total expected goals are: 2.9
But 2.9 expected goals does not mean Over 2.5 has a 100% chance.
Poisson estimates the probability of all possible totals.
In this example, the calculated probability of Over 2.5 is approximately: 55.4%
That corresponds to fair decimal odds of roughly: 1 ÷ 0.554 = 1.81
So if your model is accurate and a bookmaker offers Over 2.5 at 2.00, the price may look attractive.
If the bookmaker offers only 1.65, the situation is very different.
This is how a model can help separate prediction from price.
Using Poisson for Over 1.5 Goals
With the same 1.8 and 1.1 expected-goals inputs, the probability of at least two total goals is about: 78.5%
Fair odds would be approximately: 1 ÷ 0.785 = 1.27
If a bookmaker is offering 1.25, there may be little or no theoretical advantage.
Again, the point is not simply predicting that goals will happen.
It is comparing estimated probability with available odds.
Using Poisson for BTTS
Both Teams to Score requires:
- Home team scores at least once
- Away team scores at least once
There is a shortcut.
First find the probability each team scores zero.
In our example: Home 0 goals: 16.5% Away 0 goals: 33.3%
So: Home scores at least once: 83.5%
Away scores at least once: 66.7%
Multiply them: 0.835 × 0.667 ≈ 55.7%
So the model gives BTTS – Yes an approximate probability of: 55.7%
Fair odds: 1 ÷ 0.557 ≈ 1.80
That is a clean and practical way to estimate BTTS.
Using Poisson for Match Result
The same score matrix can estimate:
- Home win
- Draw
- Away win
In our example, approximate probabilities are:
- Home win: 53.8%
- Draw: 23.1%
- Away win: 23.1%
These add to roughly 100%.
The model therefore sees the home team as favourite, but not overwhelmingly so.
This is useful because you can compare the probabilities across different markets.
Perhaps the home-win price is poor, but Over 2.5 offers better value.
Why Poisson Is Useful
Poisson forces you to think in probabilities rather than certainties.
Instead of saying: “This match will finish Over 2.5.”
you are saying: “My model estimates around a 55% chance of Over 2.5.”
That is a much healthier way to analyse football.
It also helps compare markets objectively.
You might discover that:
- Over 2.5 = 55%
- BTTS = 56%
- Home win = 54%
The question then becomes which market is offering the best price relative to those probabilities.
The Model Works Better With Good Inputs
Suppose your expected-goals estimate is wrong.
You give the home side λ = 2.1 when the true attacking expectation should be closer to 1.3.
Every probability generated afterwards will be distorted.
This is why the most important work happens before the formula.
Good inputs should consider:
- Venue
- Opponent strength
- Current attack
- Current defence
- xG trends
- Injuries
- Rotation
- Tactical matchup
The model is only as intelligent as the assumptions feeding it.
Why Raw Goals Alone Can Be Dangerous
Suppose a team has scored:
- 3
- 4
- 2
- 3
in its last four matches.
Its average is three goals.
Using λ = 3.0 may look logical.
But perhaps those goals came from:
- Two penalties
- A red-card advantage
- Unusually high conversion
- Weak opponents
Its underlying xG may be only 1.7.
A Poisson model using the raw three-goal average could massively overestimate its scoring probability.
Using xG or adjusted attacking strength (often found on advanced platforms like Opta Analyst) can often provide a more stable input.
Home and Away Data Should Be Separated
A team may be much stronger at home.
Suppose: Home attack
- 2.0 goals per home match
Away attack
- 1.1 goals per away match
Using the overall average of 1.55 for every fixture would hide that difference.
For a home match, use home-specific attacking data where possible.
Likewise, compare it with the opponent’s away defensive record.
This makes the expected λ more relevant to the actual match.
A Simple Way to Estimate Lambda
One basic method is: Home expected goals = average of home scoring rate and away conceding rate
Suppose: Home team scores 1.8 per home match. Away team concedes 1.4 per away match.
A simple estimate might be: (1.8 + 1.4) ÷ 2 = 1.6
For the away side: Away team scores 1.1. Home team concedes 0.9.
(1.1 + 0.9) ÷ 2 = 1.0
So: Home λ = 1.6 Away λ = 1.0
This is very basic, but it shows the idea.
More sophisticated approaches adjust against league averages and opponent strength.
Why League Average Matters
Suppose a team scores 1.8 goals per match.
Is that good?
It depends on the league.
If the league average is 1.3 goals per team, the attack is strong.
If the league average is 1.7, it is much closer to normal.
Advanced Poisson models often calculate attack and defence strength relative to the competition average.
For example: Attack Strength = Team Goals Scored ÷ League Average Goals
This allows teams to be judged relative to the environment they play in.
Poisson Assumes Goals Are Independent
This is one of the model’s biggest weaknesses.
Basic Poisson assumes goal events happen independently and at a reasonably constant rate.
Real football does not behave that neatly.
A goal changes the match.
At 1-0:
- The leading team may defend deeper.
- The trailing team may attack more.
- More counterattacking space may appear.
At 2-0:
- Tempo may drop.
- The winning team may make defensive substitutions.
The probability of the next goal therefore depends partly on what already happened.
Basic Poisson does not fully capture that.
Red Cards Are Another Major Problem
Suppose your pre-match model expects: Home λ = 1.5 Away λ = 1.2
Then the away team receives a red card after 15 minutes.
The original model becomes much less relevant.
The entire scoring environment has changed.
This is why Poisson is usually more useful as a pre-match baseline rather than an unchanging truth throughout the game.
For live betting, the expected-goals rates need to be adjusted.
Low-Scoring Matches Can Be Misestimated
Basic independent Poisson models can sometimes underestimate the special behaviour of low-score outcomes such as:
- 0-0
- 1-0
- 0-1
- 1-1
Football researchers have developed adjustments to deal with this.
One well-known approach is the Dixon-Coles model, which modifies a Poisson framework to better account for dependence in low-scoring football results.
For most everyday bettors, you do not need to build a full Dixon-Coles model.
But it is useful to understand that basic Poisson is a starting model, not the final word in football statistics.
Practical Example: Finding Value
Imagine your model estimates: Over 2.5 probability: 58%
Fair odds: 1 ÷ 0.58 = 1.72
The bookmaker offers: 1.95
Your model suggests potential value.
Now consider another match.
Model probability: Over 2.5 = 52%
Fair odds: 1.92
Bookmaker price: 1.70
You might still think the match looks good for goals.
But the price is too short relative to your estimate.
Poisson helps make that difference visible.
Practical Example: Avoiding an Over
Suppose a match appears attractive because both teams recently produced several high-scoring results.
But after adjusting for:
- xG
- Home-away splits
- Opponent strength
you estimate: Home λ = 1.25 Away λ = 0.95
Combined expected goals: 2.20
Your Poisson model now gives a much weaker Over 2.5 probability.
This can stop you from following an eye-catching recent trend that is not supported by the underlying numbers.
Practical Example: Team Total
Imagine a strong home favourite has: λ = 2.1
You want to know the probability it scores at least two goals.
Using Poisson, calculate: Probability 0 goals + Probability 1 goal.
Then subtract that from 100%.
If that produces, for example, a probability around 62%, the fair price for Home Team Over 1.5 would be approximately: 1 ÷ 0.62 = 1.61
If the bookmaker offers 1.85, that might deserve further investigation.
This is one of the model’s most useful applications.
Poisson Should Be Combined With Football Knowledge
A purely mathematical model can miss important information.
Before trusting the output, ask:
- Is the main striker starting?
- Is the goalkeeper unavailable?
- Is this a must-win match?
- Is heavy rotation expected?
- Has the manager changed tactics?
- Is the pitch or weather unusual?
- Does one team need only a draw?
These variables may justify changing your expected-goals inputs.
The strongest approach combines statistical modelling with current football context.
Poisson Model Checklist
Before using the model, check:
- Home attacking strength
- Away attacking strength
- Home defensive strength
- Away defensive strength
- League scoring average
- xG and xGA
- Home-away splits
- Opponent quality
- Team news
- Tactical changes
- Sample size
- Whether unusual recent results distorted the data
Then calculate expected goals and compare your probabilities with the bookmaker’s odds.
Frequently Asked Questions
What does lambda mean in a Poisson model?
Lambda represents the expected number of goals for a team in the match.
Can Poisson predict exact football scores?
It can estimate the probability of each scoreline, but it cannot predict a correct score with certainty.
Is Poisson useful for Over 2.5?
Yes. By combining home and away goal probabilities, you can estimate the chance of three or more total goals.
Can Poisson be used for BTTS?
Yes. Calculate the probability each team scores at least once and combine the two probabilities.
What is the biggest weakness of Poisson?
The basic model assumes goals occur independently at a relatively constant rate, while real football changes according to score, red cards, tactics and substitutions.
Final Thoughts
The Poisson model is useful because it turns football predictions into probabilities.
Instead of saying: “I think this match has goals.”
you can estimate: “My model gives Over 2.5 a 55% probability.”
That allows you to compare your prediction with the bookmaker’s price.
The mathematics itself is not the difficult part.
The difficult part is estimating each team’s expected goals accurately.
Good inputs require xG, home-away form, attacking and defensive strength, team news and tactical context. Poor inputs will produce precise-looking but misleading probabilities.
Used properly, Poisson is best treated as a framework.
It gives your analysis structure, helps calculate fair odds and makes it easier to compare Over/Under, BTTS, team totals and correct scores.
It will never remove uncertainty from football.
But it can make that uncertainty much easier to measure.
Responsible betting: Mathematical models estimate probabilities rather than guaranteed outcomes. Test any model over a large sample, compare your estimates with market prices, keep stakes controlled and never bet money you cannot afford to lose.