
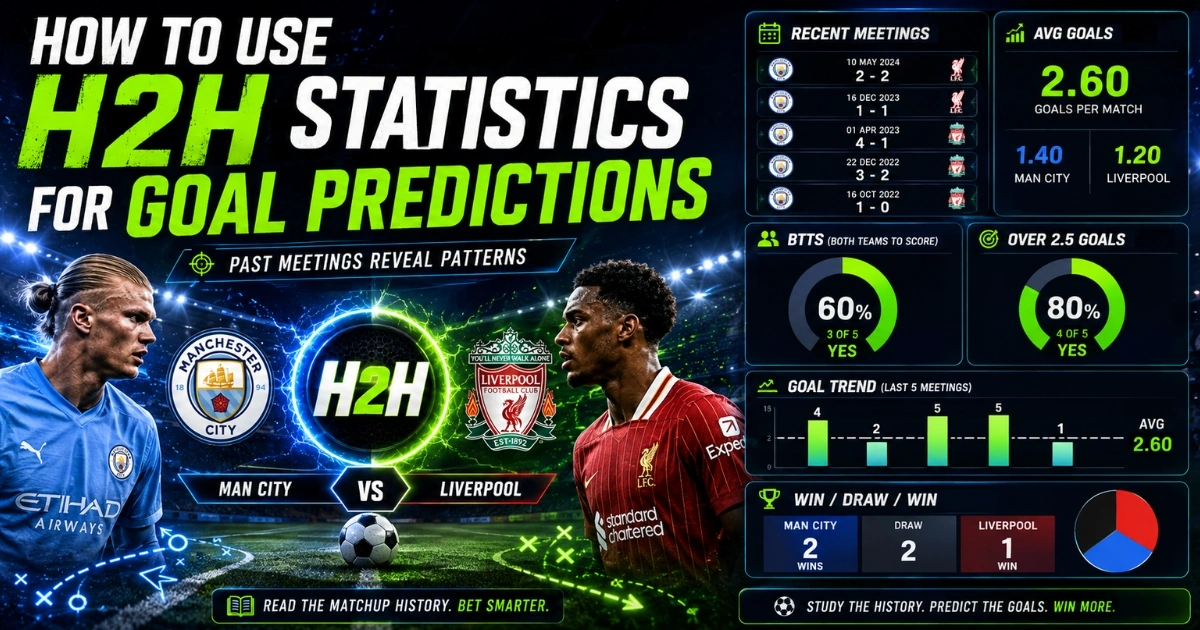
Head-to-head statistics are often one of the first things people check before predicting football goals.
If the last four meetings between two teams produced at least three goals, Over 2.5 can look like the obvious choice. If both teams scored in five consecutive encounters, BTTS – Yes may seem equally attractive.
The problem is that H2H data can be useful and misleading at the same time.
Previous meetings may reveal a genuine tactical pattern, especially when the same managers, players and playing styles are still involved. But an old 4–3 result has limited value when both squads have changed, one club has appointed a defensive coach and the match is now being played in a different competition.
The best approach is to use H2H statistics as supporting evidence, not as the entire prediction.
H2H data should be combined with the broader factors covered in our complete guide to football goal predictions, including recent form, venue splits, scoring records and match context.
If the two teams have never played each other, the absence of direct history does not prevent a strong analysis. Our guide on how to predict goals when two teams have never met explains how home-away form, xG, league strength and tactical comparisons can replace H2H data.
What Are H2H Statistics?
H2H stands for head-to-head. It refers to previous matches played between the same two teams.
For goal predictions, the most common H2H statistics include:
Total goals scored in previous meetings
Over 2.5 and Under 2.5 results
Both Teams to Score results
Clean sheets
Average goals per match
First-half goals
Home and away results
Consecutive scoring patterns
Suppose Team A and Team B have met six times, with the following scores:
2–1
1–1
3–0
2–2
1–0
3–1
Four of the six matches finished Over 2.5, while both teams scored in four. The average was approximately 2.8 goals per match.
Those numbers are useful, but they are only the beginning of the analysis.
Start With the Most Recent Meetings
Recent H2H results normally deserve more attention than matches played several years ago.
A meeting from the previous season may involve largely the same squad, manager and tactical approach. A match from five years earlier may have almost no connection to the current teams.
As a practical rule, start with the latest three to six encounters. Then check whether those matches took place under comparable conditions.
Ask:
Were the same managers in charge?
Did the teams play in the same division?
Were the key attackers and defenders involved?
Were the matches competitive?
Did the venue remain the same?
Was one meeting affected by an early red card?
Recency alone is not enough. A recent cup match played with heavily rotated teams may be less relevant than an older league fixture featuring the strongest line-ups.
Current team news can also break an otherwise relevant H2H pattern. Our guide to how missing defenders affect football goal predictions explains how goalkeeper changes, unfamiliar centre-back partnerships and tactical adjustments can alter the expected result.
Check the Over 2.5 Pattern
One of the simplest H2H calculations is the Over 2.5 percentage.
If four of the last five meetings produced three or more goals, the rate is 80%.
That may support another Over prediction, especially if the teams’ current statistics also point towards goals.
To evaluate those current indicators, use our guide on how to predict Over 2.5 goals through goal averages, home and away records, xG, shots on target and defensive statistics.
However, look at how the Over results were produced.
There is a difference between:
2–1, 2–2, 3–1 and 1–3
and:
5–0, 4–0, 0–3 and 6–0
The first group suggests that both teams can contribute. The second may show that one side repeatedly dominates the other.
That distinction matters when choosing between Over 2.5 and BTTS.
Our BTTS vs Over 2.5 goals comparison explains how to choose between the markets when both teams regularly contribute or when one side produces most of the goals.
If one team is responsible for nearly all the goals, Over 2.5 may remain attractive while BTTS – Yes becomes much weaker.
Use BTTS H2H Statistics Carefully
A sequence of BTTS results can reveal that the teams regularly create chances against each other.
For example:
2–1
1–1
3–2
2–2
Both teams scored in all four matches. That is a clear pattern, but you still need to confirm that both current attacks are reliable.
Check each team’s present:
Scoring rate
Failure-to-score percentage
Home or away performance
Expected goals
Attacking injuries
Suppose the visitors scored in every recent H2H meeting but have now lost their leading striker and failed to score in five of their last seven away matches. The historical BTTS pattern becomes less convincing.
H2H statistics describe what happened before. Current form helps decide whether it can happen again.
Our expected goals guide explains how xG and xGA can show whether current scoring and defensive performances are supported by genuine chance quality or misleading final results.
Compare Home and Away Meetings
The venue can significantly change an H2H pattern.
A team may dominate the matchup at home but struggle away. Mixing all meetings together can hide this difference.
Imagine the last six meetings produced:
At Team A’s stadium: 3–1, 2–0, 4–1
At Team B’s stadium: 0–0, 1–0, 1–1
The overall average is still respectable, but the venue split tells a much clearer story. Matches hosted by Team A are high-scoring, while games at Team B’s ground are generally tighter.
For the next fixture, prioritise meetings played at the same venue. Then compare them with each team’s current home and away records.
Our guide to home and away form for goal bets explains how the home team’s current home profile should be compared directly with the visitor’s away scoring and defensive record.
This is particularly useful when one club plays far more aggressively in front of its own supporters.
Look at the Average, but Check the Distribution
Average goals per H2H match can be helpful, but it can also be distorted by one extreme score.
Suppose five meetings finished:
0–0
1–0
1–1
1–0
6–2
The total is 12 goals, producing an average of 2.4 per match. That number may suggest a reasonably balanced scoring history, but four of the five games actually stayed Under 2.5.
The 6–2 result has inflated the average.
Always compare the average with the distribution of results. Ask how many matches actually crossed the selected line.
For goal betting, frequency is often more useful than one headline average.
When the result distribution shows a consistent low-scoring pattern, our guide on how to predict Under 2.5 goals explains which attacking, defensive and tactical indicators should support the lower-total market.
Check Whether the Matchup Creates a Tactical Pattern
The strongest H2H trends usually have a football explanation behind them.
Perhaps one team presses high, while the other struggles to play through pressure. Maybe both sides use attacking full-backs and leave space during transitions. One team could also have repeated problems defending the opponent’s set pieces.
A pattern becomes more convincing when you can explain why it exists.
For example, four high-scoring H2H meetings may have involved:
The same attacking managers
Similar formations
Frequent counterattacks
Weak defensive transitions
Strong set-piece threats
That is more meaningful than a group of high scores caused by penalties, red cards and defensive mistakes that are unlikely to repeat.
Do not only ask what happened. Ask why it happened.
Separate League, Cup and Friendly Matches
Not every H2H match should carry the same weight.
League matches usually provide the most reliable comparison because both sides are competing under familiar conditions.
Cup matches may be affected by:
Rotation
Two-legged aggregate situations
Extra time concerns
A greater willingness to take risks
A weaker team defending deeply
Friendlies are even less reliable. Managers may use several substitutes, experiment with formations and place little importance on the final result.
If the next match is a league fixture, prioritise previous league meetings. If it is a knockout second leg, older cup meetings may become more relevant because the tactical demands are similar.
Even then, the current aggregate score remains the most important context. Read our guide to second-leg goal patterns for a deeper explanation of how urgency and qualification scenarios affect scoring.
Combine H2H With Current Goal Statistics
H2H works best when it confirms what current data already suggests.
Suppose the last four meetings were Over 2.5. The home team has also recorded Over 2.5 in seven of ten home games, while the visitors have done the same in six of ten away matches.
Both teams average more than 1.5 goals scored, and neither keeps many clean sheets.
Now the H2H trend is supported by independent evidence.
A weaker example would be:
Four previous H2H matches were Over 2.5
Both teams currently average below one goal per match
Their recent fixtures are mostly Under
Several attackers are unavailable
In that case, the historical pattern should not outweigh the current numbers.
Practical Example: Choosing the Right Goal Market
Imagine the last five meetings between two teams finished:
2–1
1–1
3–1
2–2
2–0
The H2H data shows:
Over 2.5 in three of five matches
BTTS in four of five
Average of 3.0 goals
The home team scored in all five meetings
Now add the current statistics:
The home team has scored in nine of ten home games.
The visitors have scored in seven of ten away matches.
Both teams concede more than 1.3 goals per match.
Neither has important attacking absences.
BTTS – Yes may be the better fit because both teams have regularly contributed, while a 1–1 result remains possible.
If the visitors had instead failed to score in six of ten away matches, Over 2.5 might depend too heavily on the home team. A home-team goal market could then be more suitable than BTTS.
When H2H Statistics Should Be Ignored
H2H data may deserve very little weight when:
The previous matches are several years old.
Both teams have changed managers.
Most key players have left.
The clubs now play in different divisions.
Old matches were friendlies.
Several results were affected by red cards.
The next match has a completely different tactical context.
Extra caution is needed when one club has recently moved into a stronger division, because earlier meetings and domestic statistics may reflect a different competitive level. Our guide to analysing newly promoted teams explains how to adjust for that change.
Matches distorted by dismissals should be treated carefully because the card may have changed both teams’ scoring potential. Our guide explains how red cards affect Over/Under goal bets.
It is also dangerous to rely on tiny samples. Two high-scoring meetings do not establish a dependable trend.
The smaller the sample, the more support you need from current statistics.
A Simple H2H Goal-Prediction Checklist
Before using an H2H trend, check:
How recent are the meetings?
How many matches are included?
Were they played at the same venue?
Were they league, cup or friendly fixtures?
Are the managers and key players still involved?
Did red cards or penalties distort the scores?
Did both teams contribute to the goals?
Do current home and away statistics support the pattern?
Is there a tactical reason for the trend?
Does the available price offer value?
If the historical and current evidence agree, H2H can strengthen the prediction. If they conflict, current form usually deserves greater weight.
Frequently Asked Questions
How many H2H matches should I analyse?
The latest three to six meetings are usually enough for a practical review. Older results should carry less weight unless the teams have remained tactically similar.
Is a 100% H2H Over rate reliable?
It depends on the sample. Three Over results are less convincing than eight, and even a long pattern can become irrelevant after major squad or managerial changes.
Should home and away H2H records be separated?
Yes. The venue can significantly affect tactics, possession and scoring patterns.
Is H2H more important than current form?
Usually not. H2H should support current form, team news and tactical analysis rather than replace them.
Can H2H help with first-half goal predictions?
Yes. Check first-half scores, 0–0 half-time rates and whether the teams regularly score early against each other. The same rules about recency and context still apply.
For a complete early-goal analysis, read our guide on how to predict Over 0.5 first-half goals using first-half scoring rates, 0–0 half-time percentages and chance creation.
Final Thoughts
H2H statistics can add useful context to football goal predictions, but they should never be followed blindly.
Recent meetings, venue-specific results, Over and BTTS percentages and average goals can reveal a genuine matchup pattern. The data becomes much stronger when the same managers, players and tactical styles are still present.
The key is to combine history with current evidence.
Use H2H to confirm a prediction built from recent form, home and away records, chance creation, team news and match context. When those factors point in the same direction, the historical trend becomes meaningful. When they disagree, the current teams matter more than the names on an old scoreline.
Explore our football betting resources for more guides covering goal markets, football statistics and prediction strategies.
Responsible betting: Football statistics can improve analysis, but they cannot guarantee a result. Set a fixed budget and never stake money you cannot afford to lose.